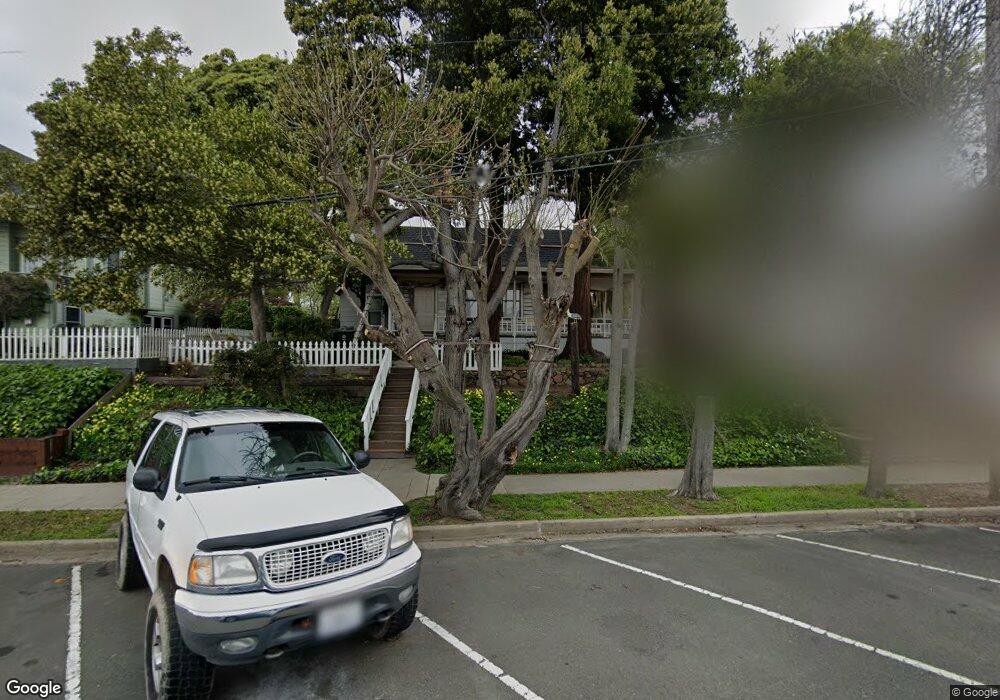
165 W F St Benicia, CA 94510
Estimated Value: $633,383 - $831,000
4
Beds
1
Bath
1,196
Sq Ft
$636/Sq Ft
Est. Value
About This Home
This home is located at 165 W F St, Benicia, CA 94510 and is currently estimated at $760,846, approximately $636 per square foot. 165 W F St is a home located in Solano County with nearby schools including Mary Farmar Elementary School, Benicia Middle School, and Benicia High School.
Ownership History
Date
Name
Owned For
Owner Type
Purchase Details
Closed on
Sep 11, 1995
Sold by
Beaubien Dayna Ann
Bought by
Beaubien Dayna Ann and Smith Leda
Current Estimated Value
Purchase Details
Closed on
Feb 10, 1994
Sold by
Rice Robyn D
Bought by
Beaubien Dayna Ann
Home Financials for this Owner
Home Financials are based on the most recent Mortgage that was taken out on this home.
Original Mortgage
$57,000
Interest Rate
7.24%
Create a Home Valuation Report for This Property
The Home Valuation Report is an in-depth analysis detailing your home's value as well as a comparison with similar homes in the area
Home Values in the Area
Average Home Value in this Area
Purchase History
| Date | Buyer | Sale Price | Title Company |
|---|---|---|---|
| Beaubien Dayna Ann | -- | -- | |
| Beaubien Dayna Ann | $36,000 | -- |
Source: Public Records
Mortgage History
| Date | Status | Borrower | Loan Amount |
|---|---|---|---|
| Closed | Beaubien Dayna Ann | $57,000 |
Source: Public Records
Tax History Compared to Growth
Tax History
| Year | Tax Paid | Tax Assessment Tax Assessment Total Assessment is a certain percentage of the fair market value that is determined by local assessors to be the total taxable value of land and additions on the property. | Land | Improvement |
|---|---|---|---|---|
| 2025 | $1,979 | $175,243 | $71,857 | $103,386 |
| 2024 | $1,979 | $171,808 | $70,449 | $101,359 |
| 2023 | $1,930 | $168,440 | $69,068 | $99,372 |
| 2022 | $1,893 | $165,138 | $67,715 | $97,423 |
| 2021 | $1,853 | $161,901 | $66,388 | $95,513 |
| 2020 | $1,828 | $160,242 | $65,708 | $94,534 |
| 2019 | $1,794 | $157,101 | $64,420 | $92,681 |
| 2018 | $1,747 | $154,021 | $63,157 | $90,864 |
| 2017 | $1,705 | $151,002 | $61,919 | $89,083 |
| 2016 | $1,710 | $148,042 | $60,705 | $87,337 |
| 2015 | $1,665 | $145,820 | $59,794 | $86,026 |
| 2014 | $1,644 | $142,964 | $58,623 | $84,341 |
Source: Public Records
Map
Nearby Homes