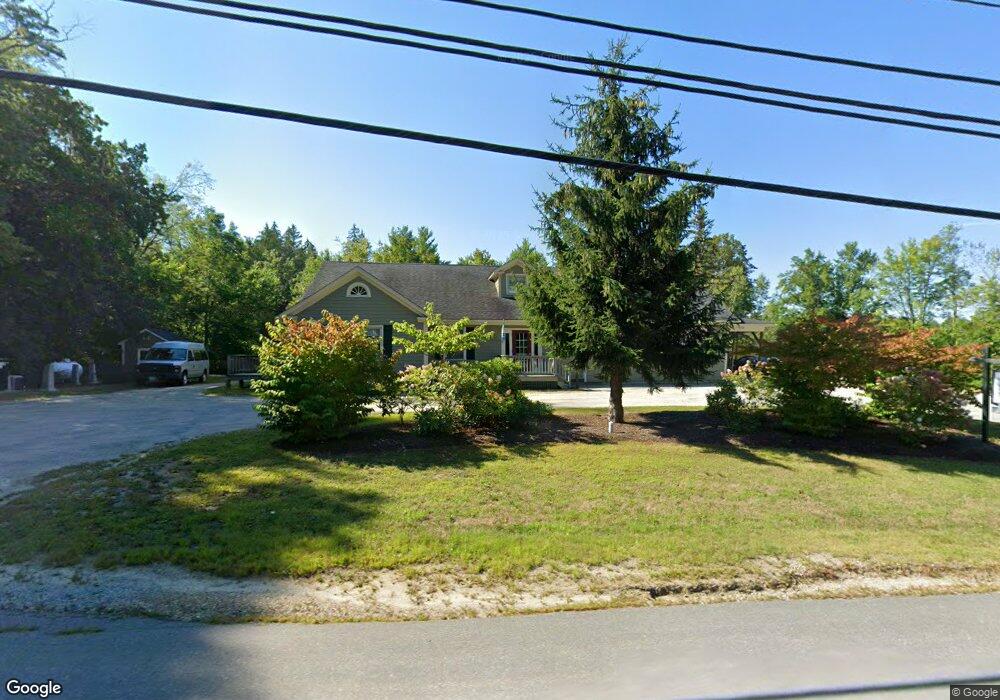
165 Wilton Rd Peterborough, NH 03458
Estimated Value: $723,000 - $1,232,000
3
Beds
1
Bath
1,600
Sq Ft
$563/Sq Ft
Est. Value
About This Home
This home is located at 165 Wilton Rd, Peterborough, NH 03458 and is currently estimated at $900,486, approximately $562 per square foot. 165 Wilton Rd is a home located in Hillsborough County with nearby schools including Peterborough Elementary School, South Meadow School, and Conval Regional High School.
Ownership History
Date
Name
Owned For
Owner Type
Purchase Details
Closed on
Sep 10, 2009
Sold by
Fhlmc
Bought by
Robin Hill Re Hldgs Ll
Current Estimated Value
Purchase Details
Closed on
Mar 26, 2009
Sold by
Mcbride Bridget and Mcbride Fhlmc
Bought by
Fhlmc
Purchase Details
Closed on
Jul 23, 2001
Sold by
Hayes John E and Hayes Mary J
Bought by
Mcbride Bridget
Home Financials for this Owner
Home Financials are based on the most recent Mortgage that was taken out on this home.
Original Mortgage
$123,250
Interest Rate
7.2%
Mortgage Type
Purchase Money Mortgage
Create a Home Valuation Report for This Property
The Home Valuation Report is an in-depth analysis detailing your home's value as well as a comparison with similar homes in the area
Home Values in the Area
Average Home Value in this Area
Purchase History
| Date | Buyer | Sale Price | Title Company |
|---|---|---|---|
| Robin Hill Re Hldgs Ll | $121,500 | -- | |
| Fhlmc | $134,800 | -- | |
| Mcbride Bridget | $145,000 | -- |
Source: Public Records
Mortgage History
| Date | Status | Borrower | Loan Amount |
|---|---|---|---|
| Open | Mcbride Bridget | $640,000 | |
| Closed | Mcbride Bridget | $110,000 | |
| Previous Owner | Mcbride Bridget | $123,250 |
Source: Public Records
Tax History Compared to Growth
Tax History
| Year | Tax Paid | Tax Assessment Tax Assessment Total Assessment is a certain percentage of the fair market value that is determined by local assessors to be the total taxable value of land and additions on the property. | Land | Improvement |
|---|---|---|---|---|
| 2024 | $15,395 | $473,700 | $80,700 | $393,000 |
| 2023 | $13,354 | $473,700 | $80,700 | $393,000 |
| 2022 | $12,237 | $473,200 | $80,700 | $392,500 |
| 2021 | $12,190 | $473,200 | $80,700 | $392,500 |
| 2020 | $11,426 | $370,500 | $48,900 | $321,600 |
| 2019 | $11,022 | $370,500 | $48,900 | $321,600 |
| 2018 | $11,148 | $370,500 | $48,900 | $321,600 |
| 2017 | $9,325 | $296,400 | $48,500 | $247,900 |
| 2016 | $9,141 | $296,400 | $48,500 | $247,900 |
| 2015 | $8,806 | $296,400 | $48,500 | $247,900 |
| 2014 | $8,367 | $273,800 | $38,100 | $235,700 |
Source: Public Records
Map
Nearby Homes