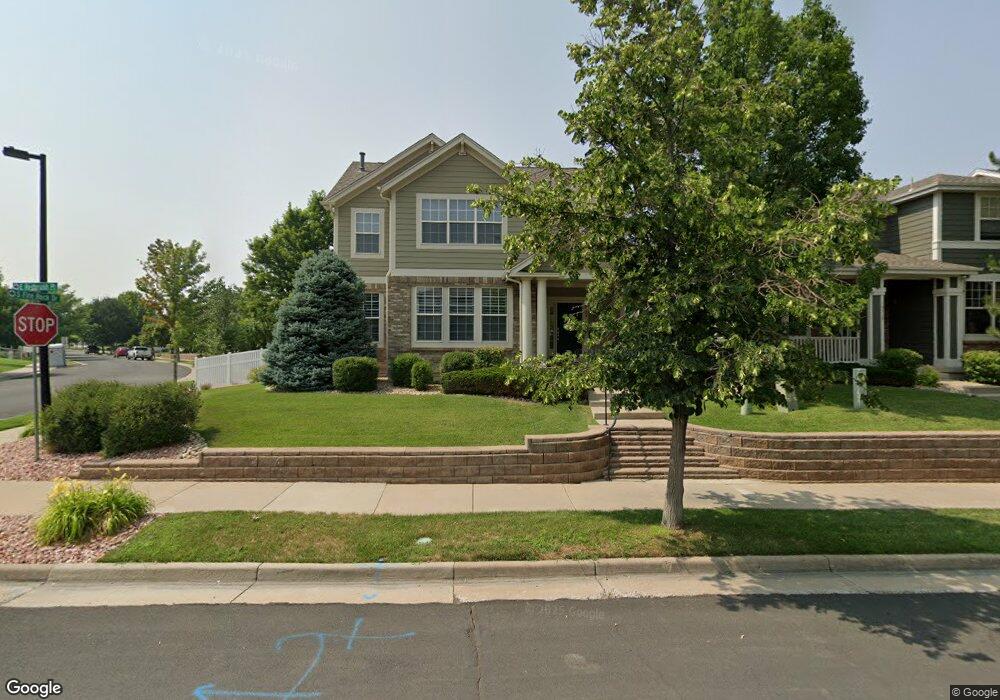
16503 Red Brush Place Parker, CO 80134
Bradbury Ranch NeighborhoodEstimated Value: $703,000 - $735,000
5
Beds
4
Baths
4,292
Sq Ft
$167/Sq Ft
Est. Value
About This Home
This home is located at 16503 Red Brush Place, Parker, CO 80134 and is currently estimated at $717,500, approximately $167 per square foot. 16503 Red Brush Place is a home located in Douglas County with nearby schools including Prairie Crossing Elementary School, Sierra Middle School, and Chaparral High School.
Ownership History
Date
Name
Owned For
Owner Type
Purchase Details
Closed on
Nov 9, 2018
Sold by
Allen Teryon A and Nordbyallen Jody A
Bought by
Bender Joel M and Bender Michelle A
Current Estimated Value
Purchase Details
Closed on
May 26, 2011
Sold by
Candela Philip A and Candela Misty A
Bought by
Allen Teryon A and Nordbyallen Jody A
Home Financials for this Owner
Home Financials are based on the most recent Mortgage that was taken out on this home.
Original Mortgage
$260,000
Interest Rate
4.95%
Mortgage Type
New Conventional
Purchase Details
Closed on
Dec 27, 2001
Sold by
The Ryland Group Inc
Bought by
Candela Philip A and Candela Misty A
Home Financials for this Owner
Home Financials are based on the most recent Mortgage that was taken out on this home.
Original Mortgage
$265,250
Interest Rate
6.41%
Create a Home Valuation Report for This Property
The Home Valuation Report is an in-depth analysis detailing your home's value as well as a comparison with similar homes in the area
Home Values in the Area
Average Home Value in this Area
Purchase History
| Date | Buyer | Sale Price | Title Company |
|---|---|---|---|
| Bender Joel M | $506,950 | Homestead Title & Escrow | |
| Allen Teryon A | $325,000 | Land Title Guarantee Company | |
| Candela Philip A | $331,600 | Cornerstone Title Co |
Source: Public Records
Mortgage History
| Date | Status | Borrower | Loan Amount |
|---|---|---|---|
| Previous Owner | Allen Teryon A | $260,000 | |
| Previous Owner | Candela Philip A | $265,250 |
Source: Public Records
Tax History Compared to Growth
Tax History
| Year | Tax Paid | Tax Assessment Tax Assessment Total Assessment is a certain percentage of the fair market value that is determined by local assessors to be the total taxable value of land and additions on the property. | Land | Improvement |
|---|---|---|---|---|
| 2024 | $4,009 | $49,580 | $8,360 | $41,220 |
| 2023 | $4,057 | $49,580 | $8,360 | $41,220 |
| 2022 | $3,189 | $36,890 | $5,720 | $31,170 |
| 2021 | $3,320 | $36,890 | $5,720 | $31,170 |
| 2020 | $3,231 | $36,500 | $6,580 | $29,920 |
| 2019 | $3,251 | $36,500 | $6,580 | $29,920 |
| 2018 | $2,840 | $31,070 | $5,920 | $25,150 |
| 2017 | $2,635 | $31,070 | $5,920 | $25,150 |
| 2016 | $2,457 | $28,440 | $5,010 | $23,430 |
| 2015 | $2,502 | $28,440 | $5,010 | $23,430 |
| 2014 | $2,589 | $26,240 | $5,010 | $21,230 |
Source: Public Records
Map
Nearby Homes
- 11300 Night Heron Dr
- 11310 Night Heron Dr
- 11367 S Blackthorn Ct
- 11387 S Blackthorn Ct
- 11343 Bradbury Ranch Dr
- 16181 White Hawk Dr
- 11029 Grouse Ct
- 15980 Donegal Ave
- 16135 Peregrine Dr
- 15857 Abbeylara Ln
- 15910 Savory Cir
- 15902 Stringhalt Way
- 10818 Mcclellan Rd
- 16116 Martingale Dr
- 16685 Trail Sky Cir
- 10968 Snowdon St
- 10896 Snowdon St
- 11206 Keota St
- 15733 Mccauley Dr
- 17187 E Cedar Gulch Dr
- 16513 Red Brush Place
- 11344 Firerock Dr
- 16523 Red Brush Place
- 11334 Firerock Dr
- 16533 Red Brush Place
- 16500 Red Brush Place
- 16512 Red Brush Place
- 11223 Bradbury Ranch Dr
- 11324 Firerock Dr
- 16522 Red Brush Place
- 11324 S Fire Rock Dr
- 11080 Night Heron Dr
- 16532 Red Brush Place
- 11314 Firerock Dr
- 11090 Night Heron Dr
- 11100 Night Heron Dr
- 11315 Firerock Dr
- 11375 Firerock Dr
- 11304 S Fire Rock Dr
- 11374 Firerock Dr