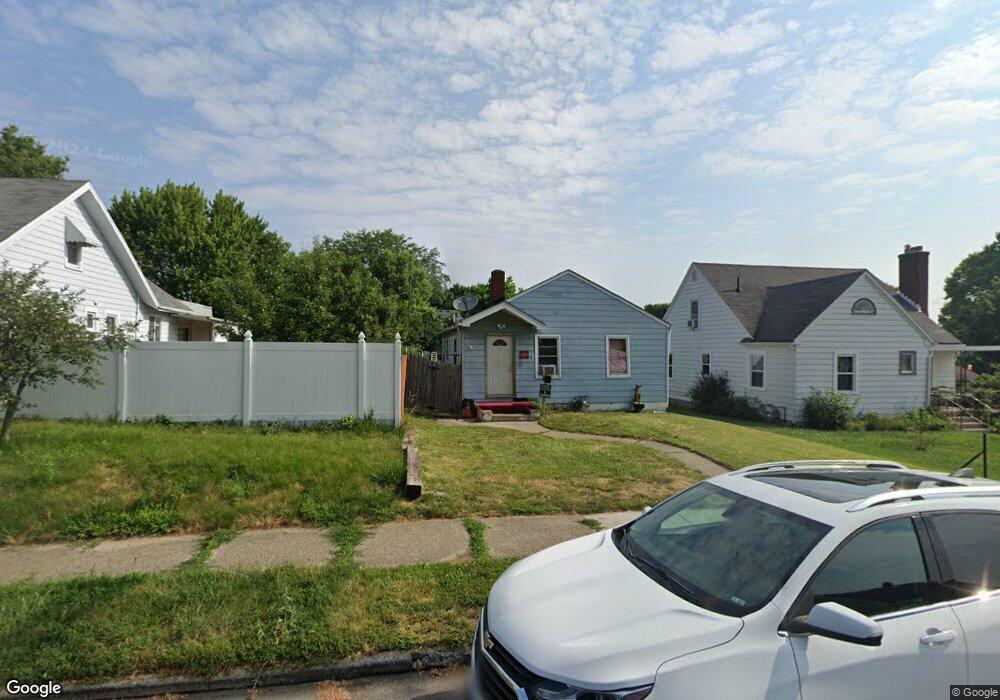
1651 Darst Ave Dayton, OH 45403
Eastern Hills NeighborhoodEstimated Value: $89,589 - $106,000
2
Beds
1
Bath
768
Sq Ft
$132/Sq Ft
Est. Value
About This Home
This home is located at 1651 Darst Ave, Dayton, OH 45403 and is currently estimated at $101,147, approximately $131 per square foot. 1651 Darst Ave is a home located in Montgomery County with nearby schools including Cleveland Elementary School, Eastmont Elementary, and Horace Mann Elementary School.
Ownership History
Date
Name
Owned For
Owner Type
Purchase Details
Closed on
Sep 13, 2010
Sold by
Stonecrest Income & Opportunity Fund I L
Bought by
Us Home Ownership Llc
Current Estimated Value
Purchase Details
Closed on
May 28, 2010
Sold by
Deutsche Bank National Trust Company
Bought by
Stonecrest Income & Opportunity Fund I L
Purchase Details
Closed on
Dec 10, 2009
Sold by
Spencer Sandra
Bought by
Deutsche Bank National Trust Company
Purchase Details
Closed on
Apr 22, 2005
Sold by
Smith Arnold
Bought by
Spencer Sandra
Home Financials for this Owner
Home Financials are based on the most recent Mortgage that was taken out on this home.
Original Mortgage
$63,200
Interest Rate
8.82%
Mortgage Type
Fannie Mae Freddie Mac
Purchase Details
Closed on
Feb 27, 2001
Sold by
Call Joseph W
Bought by
Smith Arnold
Purchase Details
Closed on
Dec 15, 2000
Sold by
Call Joseph W
Bought by
Smith Arnold
Home Financials for this Owner
Home Financials are based on the most recent Mortgage that was taken out on this home.
Original Mortgage
$27,500
Interest Rate
7.18%
Create a Home Valuation Report for This Property
The Home Valuation Report is an in-depth analysis detailing your home's value as well as a comparison with similar homes in the area
Home Values in the Area
Average Home Value in this Area
Purchase History
| Date | Buyer | Sale Price | Title Company |
|---|---|---|---|
| Us Home Ownership Llc | $8,215 | None Available | |
| Stonecrest Income & Opportunity Fund I L | $6,615 | None Available | |
| Deutsche Bank National Trust Company | $28,000 | Attorney | |
| Spencer Sandra | $60,000 | None Available | |
| Smith Arnold | $30,625 | -- | |
| Smith Arnold | $30,625 | -- |
Source: Public Records
Mortgage History
| Date | Status | Borrower | Loan Amount |
|---|---|---|---|
| Previous Owner | Spencer Sandra | $63,200 | |
| Previous Owner | Smith Arnold | $27,500 |
Source: Public Records
Tax History Compared to Growth
Tax History
| Year | Tax Paid | Tax Assessment Tax Assessment Total Assessment is a certain percentage of the fair market value that is determined by local assessors to be the total taxable value of land and additions on the property. | Land | Improvement |
|---|---|---|---|---|
| 2024 | $1,163 | $20,010 | $4,600 | $15,410 |
| 2023 | $1,163 | $20,010 | $4,600 | $15,410 |
| 2022 | $1,121 | $14,900 | $3,430 | $11,470 |
| 2021 | $1,115 | $14,900 | $3,430 | $11,470 |
| 2020 | $1,113 | $14,900 | $3,430 | $11,470 |
| 2019 | $1,040 | $12,500 | $3,430 | $9,070 |
| 2018 | $1,042 | $12,500 | $3,430 | $9,070 |
| 2017 | $1,034 | $12,500 | $3,430 | $9,070 |
| 2016 | $1,077 | $12,740 | $3,430 | $9,310 |
| 2015 | $1,019 | $12,740 | $3,430 | $9,310 |
| 2014 | $1,019 | $12,740 | $3,430 | $9,310 |
| 2012 | -- | $14,280 | $5,350 | $8,930 |
Source: Public Records
Map
Nearby Homes
- 1626 Darst Ave
- 404 S Smithville Rd
- 520 S Smithville Rd
- 1614 Huffman Ave Unit 1612
- 1629 Suman Ave
- 1730 Darst Ave
- 1800 Darst Ave
- 420 Dawnview Ave
- 1815 Huffman Ave
- 515 Heiss Ave Unit 515-517
- 1620 Gondert Ave Unit 1618
- 1620 Gondert Ave
- 1714 Gondert Ave
- 521 Pollock Rd
- 715 Gondert Ave
- 1921 Emerald Ct
- 108 Big Pine Rd
- 4533 Maughn Dr
- 511 S Hayden Ave
- 4856 Airway Rd
- 1655 Darst Ave
- 1643 Darst Ave
- 1639 Darst Ave
- 1635 Darst Ave
- 1650 Speice Ave
- 1654 Speice Ave
- 1640 Speice Ave
- 1664 Speice Ave
- 1669 Darst Ave
- 1627 Darst Ave
- 1660 Speice Ave
- 1638 Speice Ave
- 1646 Darst Ave
- 1642 Darst Ave
- 479 Mertland Ave
- 1634 Speice Ave
- 1638 Darst Ave
- 1658 Darst Ave
- 1630 Speice Ave
- 1630 Darst Ave