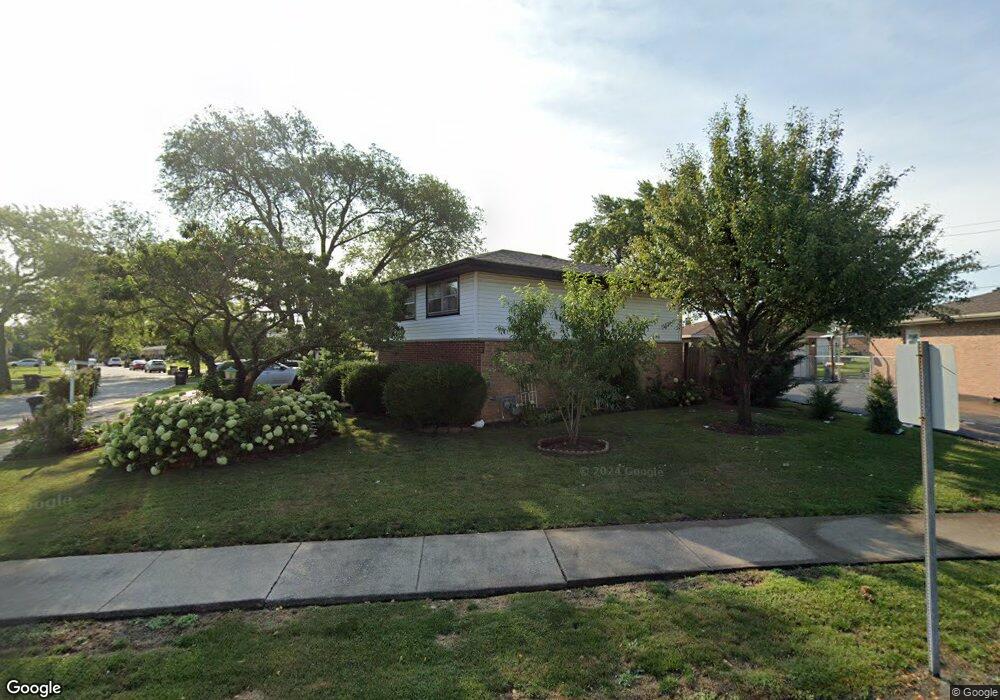
16515 Terry Ln Oak Forest, IL 60452
Estimated Value: $237,950 - $261,000
3
Beds
2
Baths
1,082
Sq Ft
$230/Sq Ft
Est. Value
About This Home
This home is located at 16515 Terry Ln, Oak Forest, IL 60452 and is currently estimated at $249,238, approximately $230 per square foot. 16515 Terry Ln is a home located in Cook County with nearby schools including Fieldcrest Elementary School, Prairie-Hills Junior High School, and Tinley Park High School.
Ownership History
Date
Name
Owned For
Owner Type
Purchase Details
Closed on
Nov 24, 2023
Sold by
Santillan Martin
Bought by
Contreras Viviana
Current Estimated Value
Home Financials for this Owner
Home Financials are based on the most recent Mortgage that was taken out on this home.
Original Mortgage
$85,000
Outstanding Balance
$83,176
Interest Rate
7.13%
Mortgage Type
New Conventional
Estimated Equity
$166,062
Purchase Details
Closed on
Sep 16, 2004
Sold by
Domke Dolores
Bought by
Santillan Martin
Home Financials for this Owner
Home Financials are based on the most recent Mortgage that was taken out on this home.
Original Mortgage
$132,000
Interest Rate
5.93%
Mortgage Type
Unknown
Purchase Details
Closed on
Jul 9, 2003
Sold by
Domke Dolores and Domke Donald Frank
Bought by
Domke Dolores and Dolores Domke Loving Trust
Create a Home Valuation Report for This Property
The Home Valuation Report is an in-depth analysis detailing your home's value as well as a comparison with similar homes in the area
Home Values in the Area
Average Home Value in this Area
Purchase History
| Date | Buyer | Sale Price | Title Company |
|---|---|---|---|
| Contreras Viviana | $165,000 | None Listed On Document | |
| Santillan Martin | $165,000 | Ticor Title | |
| Domke Dolores | -- | -- |
Source: Public Records
Mortgage History
| Date | Status | Borrower | Loan Amount |
|---|---|---|---|
| Open | Contreras Viviana | $85,000 | |
| Previous Owner | Santillan Martin | $132,000 |
Source: Public Records
Tax History
| Year | Tax Paid | Tax Assessment Tax Assessment Total Assessment is a certain percentage of the fair market value that is determined by local assessors to be the total taxable value of land and additions on the property. | Land | Improvement |
|---|---|---|---|---|
| 2025 | $7,037 | $22,000 | $3,236 | $18,764 |
| 2024 | $7,037 | $22,000 | $3,236 | $18,764 |
| 2023 | $6,272 | $22,000 | $3,236 | $18,764 |
| 2022 | $6,272 | $15,737 | $2,877 | $12,860 |
| 2021 | $6,122 | $15,736 | $2,876 | $12,860 |
| 2020 | $6,111 | $15,736 | $2,876 | $12,860 |
| 2019 | $5,547 | $14,908 | $2,697 | $12,211 |
| 2018 | $5,445 | $14,908 | $2,697 | $12,211 |
| 2017 | $5,230 | $14,908 | $2,697 | $12,211 |
| 2016 | $4,684 | $12,501 | $2,337 | $10,164 |
| 2015 | $4,424 | $12,501 | $2,337 | $10,164 |
| 2014 | $4,347 | $12,501 | $2,337 | $10,164 |
| 2013 | $4,603 | $14,543 | $2,337 | $12,206 |
Source: Public Records
Map
Nearby Homes
- 4428 Lisa Ln
- 16465 Terry Ln
- 16465 Roy St
- 4645 Milford Ave
- 16524 Brockton Ln
- 16520 Brockton Ln
- 4351 Scott St
- 16400 Roy St
- 16488 Barton Ln
- 16409 Craig Dr
- 4230 Barry Ln
- 16224 S Cicero Ave
- 16938 Cicero Ave
- 4850 162nd St
- 5113 Coulter Rd
- 16824 Meadowdale Dr
- 16909 W Thackeray Lot #8 St
- 15240 S Cicero Ave
- 16908 Laramie Ave
- 3936 169th St
Your Personal Tour Guide
Ask me questions while you tour the home.