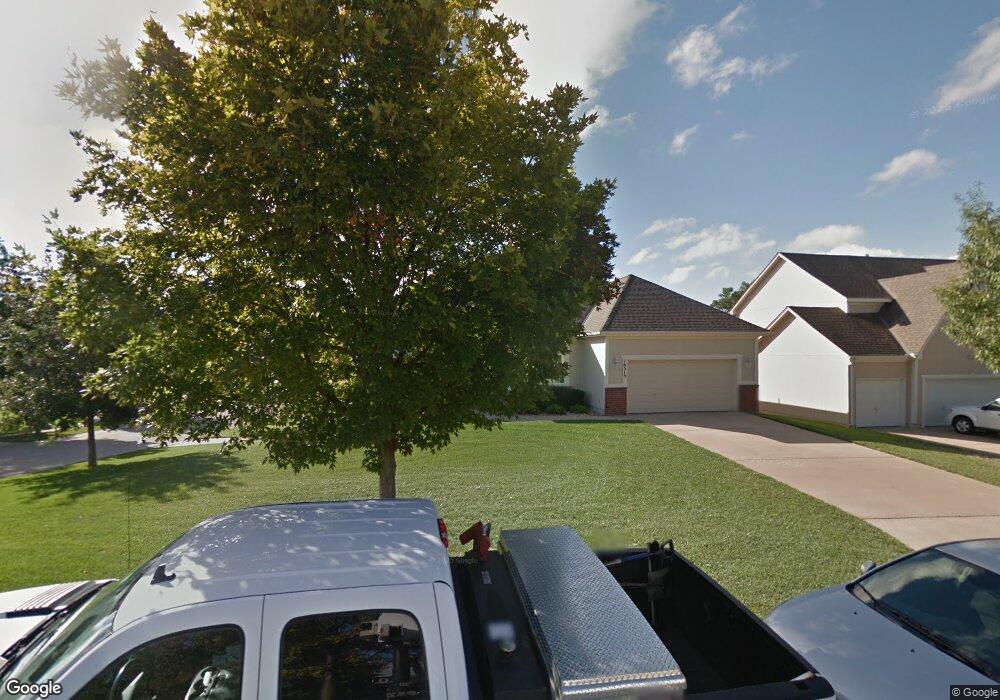
16515 W 81st St Lenexa, KS 66219
Estimated Value: $420,882 - $478,000
3
Beds
2
Baths
1,867
Sq Ft
$239/Sq Ft
Est. Value
About This Home
This home is located at 16515 W 81st St, Lenexa, KS 66219 and is currently estimated at $445,971, approximately $238 per square foot. 16515 W 81st St is a home located in Johnson County with nearby schools including Lenexa Hills Elementary School, Westridge Middle School, and Shawnee Mission West High School.
Ownership History
Date
Name
Owned For
Owner Type
Purchase Details
Closed on
Nov 25, 2019
Sold by
Bean Earl W and Bean Sharon L
Bought by
Bean Stephen B and Bean Mark E
Current Estimated Value
Purchase Details
Closed on
May 24, 2007
Sold by
Hemphill William I and Hemphill Rebecca J
Bought by
Bean Earl W and Bean Sharon L
Create a Home Valuation Report for This Property
The Home Valuation Report is an in-depth analysis detailing your home's value as well as a comparison with similar homes in the area
Home Values in the Area
Average Home Value in this Area
Purchase History
| Date | Buyer | Sale Price | Title Company |
|---|---|---|---|
| Bean Stephen B | -- | None Available | |
| Bean Earl W | -- | Chicago Title Insurance Co |
Source: Public Records
Tax History Compared to Growth
Tax History
| Year | Tax Paid | Tax Assessment Tax Assessment Total Assessment is a certain percentage of the fair market value that is determined by local assessors to be the total taxable value of land and additions on the property. | Land | Improvement |
|---|---|---|---|---|
| 2024 | $5,112 | $46,195 | $8,948 | $37,247 |
| 2023 | $5,216 | $46,345 | $8,948 | $37,397 |
| 2022 | $4,743 | $42,113 | $8,948 | $33,165 |
| 2021 | $4,402 | $37,099 | $8,948 | $28,151 |
| 2020 | $4,354 | $36,340 | $7,784 | $28,556 |
| 2019 | $4,201 | $35,041 | $6,484 | $28,557 |
| 2018 | $3,982 | $32,902 | $6,484 | $26,418 |
| 2017 | $3,779 | $30,245 | $5,896 | $24,349 |
| 2016 | $3,707 | $29,302 | $5,896 | $23,406 |
| 2015 | $3,541 | $28,175 | $5,896 | $22,279 |
| 2013 | -- | $25,541 | $5,896 | $19,645 |
Source: Public Records
Map
Nearby Homes
- 7621 Lichtenauer Dr
- 8033 Hall St
- 8308 Tomashaw St
- 15529 W 83rd Terrace
- 8531 Barstow
- 15322 W 83rd St
- 8403 Swarner Dr
- 7219 Allman Rd
- 7239 Allman Rd
- 7221 Allman Rd
- 7237 Allman Rd
- 7231 Allman Rd
- 14915 W 84th Terrace
- 14828 W 83rd Place
- 7736 Darnell St
- 7229 Allman Dr
- 16128 Midland Dr
- 8943 Boehm Dr
- 6964 Renner Rd
- 7729 Acuff Ln
- 16517 W 81st St
- 16509 W 80th Terrace
- 16509 W 81st St
- 16523 W 81st St
- 16523 W 80th Terrace
- 16505 W 80th Terrace
- 16504 W 80th Terrace
- 16522 W 81st St
- 16510 W 81st St
- 16529 W 80th Terrace
- 16507 W 81st St
- 16502 W 80th Terrace
- 16500 W 80th Terrace
- 16535 W 80th Terrace
- 16508 W 81st St
- 16505 W 81st St
- 16528 W 80th Terrace
- 16528 W 81st St
- 16534 W 81st St
- 16535 W 81st St