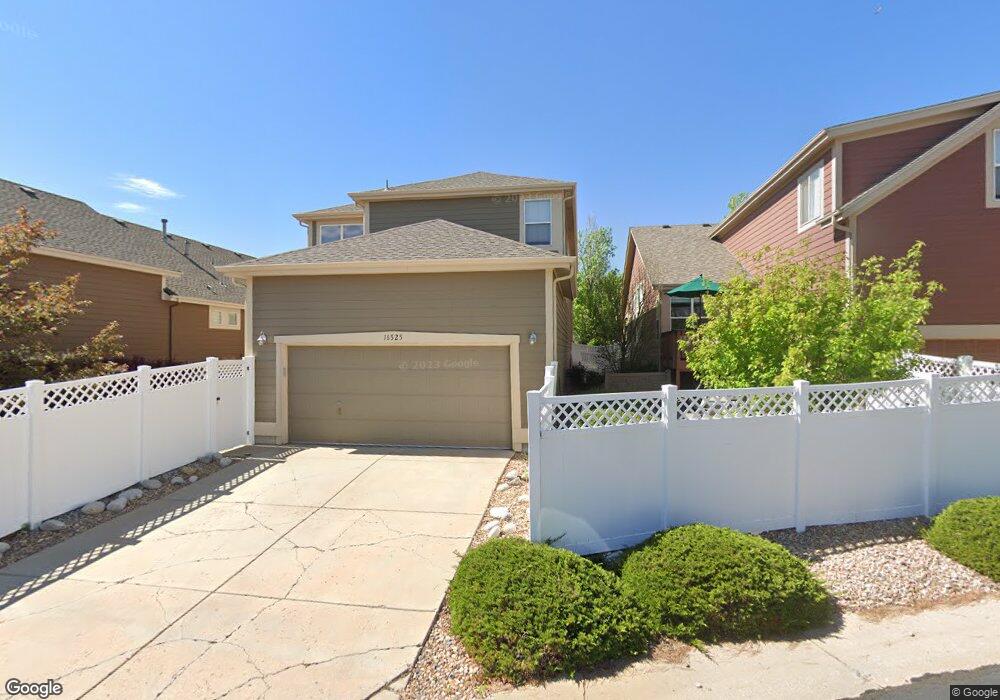
16525 E Blackthorn Way Parker, CO 80134
Bradbury Ranch NeighborhoodEstimated Value: $681,000 - $717,000
3
Beds
3
Baths
2,940
Sq Ft
$239/Sq Ft
Est. Value
About This Home
This home is located at 16525 E Blackthorn Way, Parker, CO 80134 and is currently estimated at $701,778, approximately $238 per square foot. 16525 E Blackthorn Way is a home located in Douglas County with nearby schools including Prairie Crossing Elementary School, Sierra Middle School, and Chaparral High School.
Ownership History
Date
Name
Owned For
Owner Type
Purchase Details
Closed on
Jan 16, 2023
Sold by
Kneafsey Charlotte Joan
Bought by
Kneafsey Charlotte Joan and Kneafsey Michael
Current Estimated Value
Home Financials for this Owner
Home Financials are based on the most recent Mortgage that was taken out on this home.
Original Mortgage
$345,000
Outstanding Balance
$333,796
Interest Rate
6.33%
Mortgage Type
New Conventional
Estimated Equity
$367,982
Purchase Details
Closed on
Mar 1, 2019
Sold by
Matthews Diana H and Matthews James F
Bought by
Kneafsey Charlotte Joan
Purchase Details
Closed on
Feb 14, 2006
Sold by
Doll Richard D and Doll Donna Marie
Bought by
Matthews Diana H and Matthews James F
Purchase Details
Closed on
Feb 21, 2002
Sold by
The Ryland Group Inc
Bought by
Doll Richard D and Doll Donna Marie
Home Financials for this Owner
Home Financials are based on the most recent Mortgage that was taken out on this home.
Original Mortgage
$236,000
Interest Rate
6.81%
Create a Home Valuation Report for This Property
The Home Valuation Report is an in-depth analysis detailing your home's value as well as a comparison with similar homes in the area
Home Values in the Area
Average Home Value in this Area
Purchase History
| Date | Buyer | Sale Price | Title Company |
|---|---|---|---|
| Kneafsey Charlotte Joan | -- | None Listed On Document | |
| Kneafsey Charlotte Joan | -- | None Available | |
| Matthews Diana H | $350,000 | Security Title | |
| Doll Richard D | $295,000 | Cornerstone Title Co |
Source: Public Records
Mortgage History
| Date | Status | Borrower | Loan Amount |
|---|---|---|---|
| Open | Kneafsey Charlotte Joan | $345,000 | |
| Previous Owner | Doll Richard D | $236,000 |
Source: Public Records
Tax History Compared to Growth
Tax History
| Year | Tax Paid | Tax Assessment Tax Assessment Total Assessment is a certain percentage of the fair market value that is determined by local assessors to be the total taxable value of land and additions on the property. | Land | Improvement |
|---|---|---|---|---|
| 2024 | $4,432 | $54,430 | $8,280 | $46,150 |
| 2023 | $4,485 | $54,430 | $8,280 | $46,150 |
| 2022 | $3,149 | $36,420 | $5,710 | $30,710 |
| 2021 | $3,277 | $36,420 | $5,710 | $30,710 |
| 2020 | $3,178 | $35,900 | $6,330 | $29,570 |
| 2019 | $3,198 | $35,900 | $6,330 | $29,570 |
| 2018 | $2,988 | $32,690 | $5,690 | $27,000 |
| 2017 | $2,772 | $32,690 | $5,690 | $27,000 |
| 2016 | $2,590 | $29,980 | $5,010 | $24,970 |
| 2015 | $1,319 | $29,980 | $5,010 | $24,970 |
| 2014 | $1,366 | $27,690 | $5,010 | $22,680 |
Source: Public Records
Map
Nearby Homes
- 11343 Bradbury Ranch Dr
- 11367 S Blackthorn Ct
- 11387 S Blackthorn Ct
- 11310 Night Heron Dr
- 11300 Night Heron Dr
- 16181 White Hawk Dr
- 16685 Trail Sky Cir
- 11029 Grouse Ct
- 15980 Donegal Ave
- 15910 Savory Cir
- 16752 Trail Sky Cir
- 17187 E Cedar Gulch Dr
- 15857 Abbeylara Ln
- 16135 Peregrine Dr
- 11235 S Neu Towne Cir
- 11231 S Neu Towne Cir
- 15902 Stringhalt Way
- 11206 Keota St
- 17402 E Neu Towne Pkwy
- 17039 Foxton Dr
- 16535 E Blackthorn Way
- 16515 E Blackthorn Way
- 16545 E Blackthorn Way
- 16505 E Blackthorn Way
- 11403 Bradbury Ranch Dr
- 11394 Firerock Dr
- 11394 S Fire Rock Dr
- 11383 Bradbury Ranch Dr
- 16524 E Blackthorn Way
- 11384 Firerock Dr
- 16514 E Blackthorn Way
- 16544 E Blackthorn Way
- 16504 E Blackthorn Way
- 11363 Bradbury Ranch Dr
- 16485 E Blackthorn Way
- 11374 Firerock Dr
- 16484 E Blackthorn Way
- 11385 Firerock Dr
- 11385 S Fire Rock Dr
- 16465 E Blackthorn Way