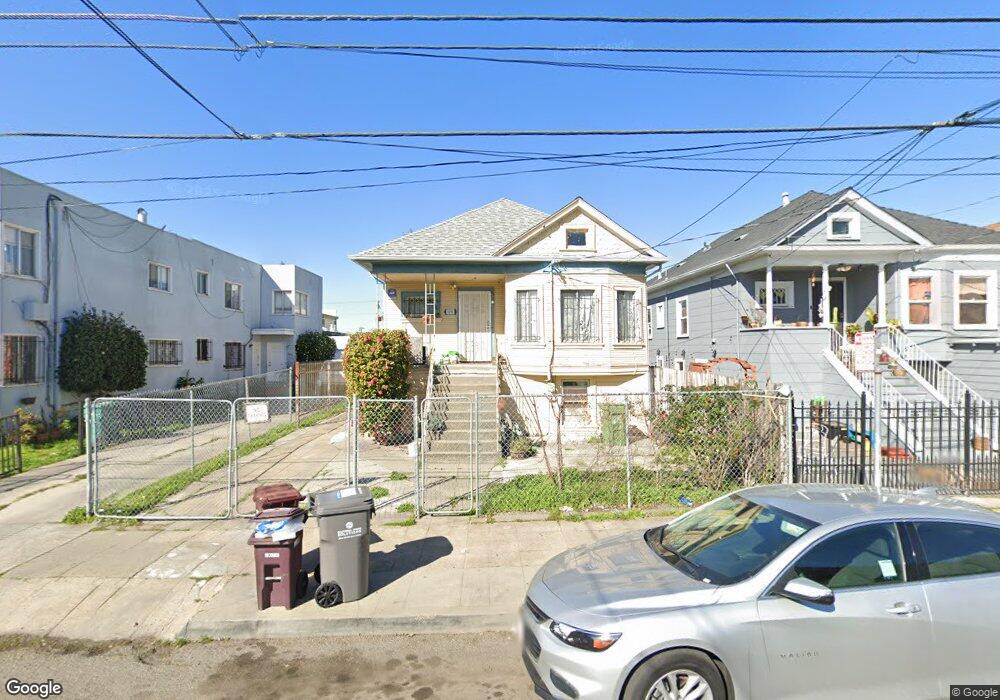
1653 46th Ave Oakland, CA 94601
Fremont NeighborhoodEstimated Value: $412,000 - $459,643
2
Beds
1
Bath
1,061
Sq Ft
$417/Sq Ft
Est. Value
About This Home
This home is located at 1653 46th Ave, Oakland, CA 94601 and is currently estimated at $442,911, approximately $417 per square foot. 1653 46th Ave is a home located in Alameda County with nearby schools including Horace Mann Elementary School, Urban Promise Academy, and United For Success Academy.
Ownership History
Date
Name
Owned For
Owner Type
Purchase Details
Closed on
Jul 11, 2015
Sold by
Situ Gen
Bought by
Situ Anna and Situ Alan
Current Estimated Value
Purchase Details
Closed on
Jun 24, 1997
Sold by
Sum Jason and Sum Chuthamat H
Bought by
Situ Gen and Situ Cai Xiao Huang
Home Financials for this Owner
Home Financials are based on the most recent Mortgage that was taken out on this home.
Original Mortgage
$72,000
Interest Rate
7.92%
Create a Home Valuation Report for This Property
The Home Valuation Report is an in-depth analysis detailing your home's value as well as a comparison with similar homes in the area
Home Values in the Area
Average Home Value in this Area
Purchase History
We collect this data history from publicly available records. To have your information removed, we recommend requesting removal directly through your county’s website.
| Date | Buyer | Sale Price | Title Company |
|---|---|---|---|
| Situ Anna | -- | None Available | |
| Situ Gen | $120,000 | Fidelity National Title Co |
Source: Public Records
Mortgage History
We collect this data history from publicly available records. To have your information removed, we recommend requesting removal directly through your county’s website.
| Date | Status | Borrower | Loan Amount |
|---|---|---|---|
| Closed | Situ Gen | $72,000 |
Source: Public Records
Tax History
| Year | Tax Paid | Tax Assessment Tax Assessment Total Assessment is a certain percentage of the fair market value that is determined by local assessors to be the total taxable value of land and additions on the property. | Land | Improvement |
|---|---|---|---|---|
| 2025 | $4,128 | $184,600 | $57,480 | $134,120 |
| 2024 | $4,128 | $180,844 | $56,353 | $131,491 |
| 2023 | $4,229 | $184,161 | $55,248 | $128,913 |
| 2022 | $4,057 | $173,550 | $54,165 | $126,385 |
| 2021 | $3,752 | $170,010 | $53,103 | $123,907 |
| 2020 | $3,708 | $175,195 | $52,558 | $122,637 |
| 2019 | $3,488 | $171,761 | $51,528 | $120,233 |
| 2018 | $3,418 | $168,394 | $50,518 | $117,876 |
| 2017 | $3,257 | $165,093 | $49,528 | $115,565 |
| 2016 | $3,072 | $161,857 | $48,557 | $113,300 |
| 2015 | $3,051 | $159,425 | $47,827 | $111,598 |
| 2014 | $2,992 | $156,303 | $46,891 | $109,412 |
Source: Public Records
Map
Nearby Homes
Your Personal Tour Guide
Ask me questions while you tour the home.