Estimated Value: $995,000 - $1,153,118
5
Beds
5
Baths
2,429
Sq Ft
$435/Sq Ft
Est. Value
About This Home
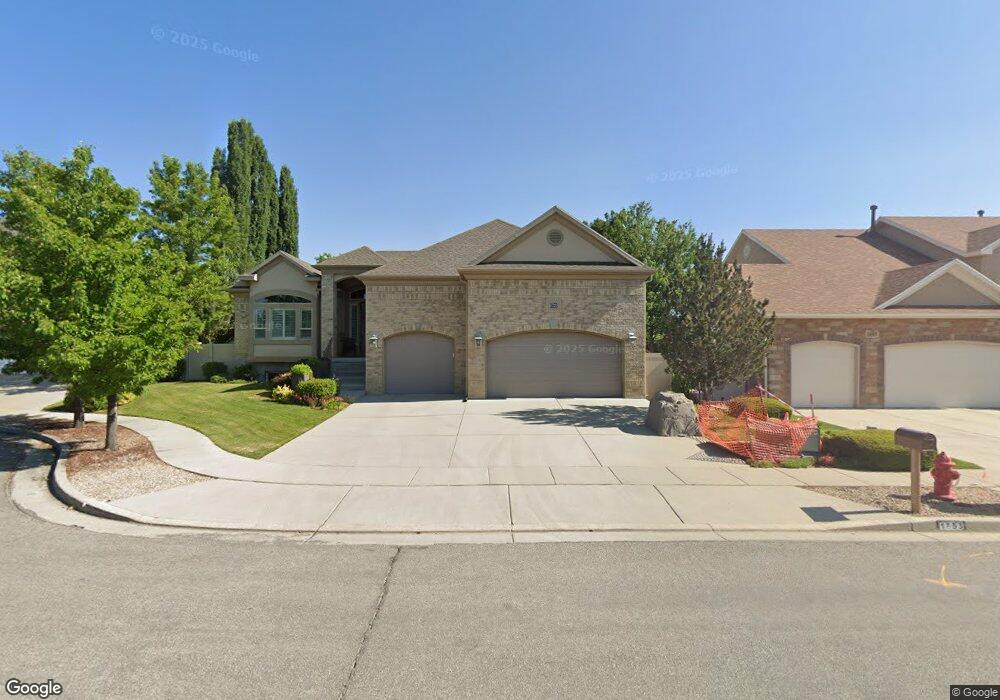
This home is located at 1653 Crescent View Cir, Sandy, UT 84092 and is currently estimated at $1,056,280, approximately $434 per square foot. 1653 Crescent View Cir is a home located in Salt Lake County with nearby schools including Sunrise Elementary School, Bell Canyon Montessori School, and Challenger School - Sandy.
Ownership History
Date
Name
Owned For
Owner Type
Purchase Details
Closed on
Oct 27, 2023
Sold by
Olsen Don R and Olsen Kris A
Bought by
Olsen
Current Estimated Value
Purchase Details
Closed on
Jul 23, 2018
Sold by
Boogaard Stephanie S and The Donald H Sly Family Trust
Bought by
Olsen Don R and Olsen Kris A
Home Financials for this Owner
Home Financials are based on the most recent Mortgage that was taken out on this home.
Original Mortgage
$565,600
Interest Rate
4.5%
Mortgage Type
New Conventional
Purchase Details
Closed on
Oct 16, 2007
Sold by
Sly Donald H and Sly Marian O
Bought by
Sly Donald H and Sly Marian O
Purchase Details
Closed on
Feb 11, 2004
Sold by
Neff Construction Inc
Bought by
Sly Donald H and Sly Marian O
Purchase Details
Closed on
Apr 28, 2000
Sold by
Sunrise Capital Llc
Bought by
Neff Construction Inc
Create a Home Valuation Report for This Property
The Home Valuation Report is an in-depth analysis detailing your home's value as well as a comparison with similar homes in the area
Home Values in the Area
Average Home Value in this Area
Purchase History
| Date | Buyer | Sale Price | Title Company |
|---|---|---|---|
| Olsen | -- | None Listed On Document | |
| Olsen Don R | -- | First American Title | |
| Sly Donald H | -- | None Available | |
| Sly Donald H | -- | Backman Stewart Title Svcs | |
| Neff Construction Inc | -- | Backman Stewart Title Servic |
Source: Public Records
Mortgage History
| Date | Status | Borrower | Loan Amount |
|---|---|---|---|
| Previous Owner | Olsen Don R | $565,600 |
Source: Public Records
Tax History
| Year | Tax Paid | Tax Assessment Tax Assessment Total Assessment is a certain percentage of the fair market value that is determined by local assessors to be the total taxable value of land and additions on the property. | Land | Improvement |
|---|---|---|---|---|
| 2025 | $5,793 | $1,046,200 | $292,800 | $753,400 |
| 2024 | $5,793 | $1,071,400 | $281,800 | $789,600 |
| 2023 | $5,793 | $987,600 | $271,000 | $716,600 |
| 2022 | $5,759 | $1,037,400 | $265,700 | $771,700 |
| 2021 | $5,198 | $797,000 | $238,800 | $558,200 |
| 2020 | $5,024 | $726,500 | $238,800 | $487,700 |
| 2019 | $5,146 | $725,200 | $225,300 | $499,900 |
| 2018 | $3,596 | $527,600 | $225,300 | $302,300 |
| 2017 | $3,513 | $492,400 | $225,300 | $267,100 |
| 2016 | $3,102 | $420,300 | $203,000 | $217,300 |
| 2015 | $3,131 | $392,500 | $215,200 | $177,300 |
| 2014 | $3,035 | $373,000 | $209,100 | $163,900 |
Source: Public Records
Map
Nearby Homes
- 1653 Crescent View Dr
- 11341 S Silver Buckle Way
- 11343 Clifford Cir
- 1234 E Sandy Ridge Dr
- 1093 Colima Dr
- 1835 E Dimple Dell Rd
- 2026 E 10765 S
- 11521 S Black Forest Dr Unit 8
- 1074 E Black Forest Dr
- 7 Rollingwood Ln
- 2234 E Willow Brook Way
- 2192 E High Mesa Dr
- 989 Sandcrest Dr
- 11202 S 1000 E Unit 3
- 11182 S 1000 E Unit 2
- 11186 S 1000 E Unit 1
- 2250 High Mountain Dr
- 2232 E Lone Eagle Ln
- 16 Gatehouse Ln
- 10557 S Primrose Dr
- 1653 E Crescent View Cir
- 1665 Crescent View Cir
- 1641 Crescent View Cir
- 1652 E 11245 S
- 1664 E 11245 S
- 1640 E 11245 S
- 1677 Crescent View Cir
- 1677 E Crescent View Cir
- 1677 Crescent View Dr
- 1629 Crescent View Cir
- 1629 E Crescent View Cir
- 1654 Crescent View Cir
- 1666 Crescent View Cir
- 1676 E 11245 S
- 1628 E 11245 S
- 1642 Crescent View Dr
- 1642 Crescent View Cir
- 1630 Crescent View Cir
- 1630 E Crescent View Cir
- 1678 E Crescent View Cir
Your Personal Tour Guide
Ask me questions while you tour the home.