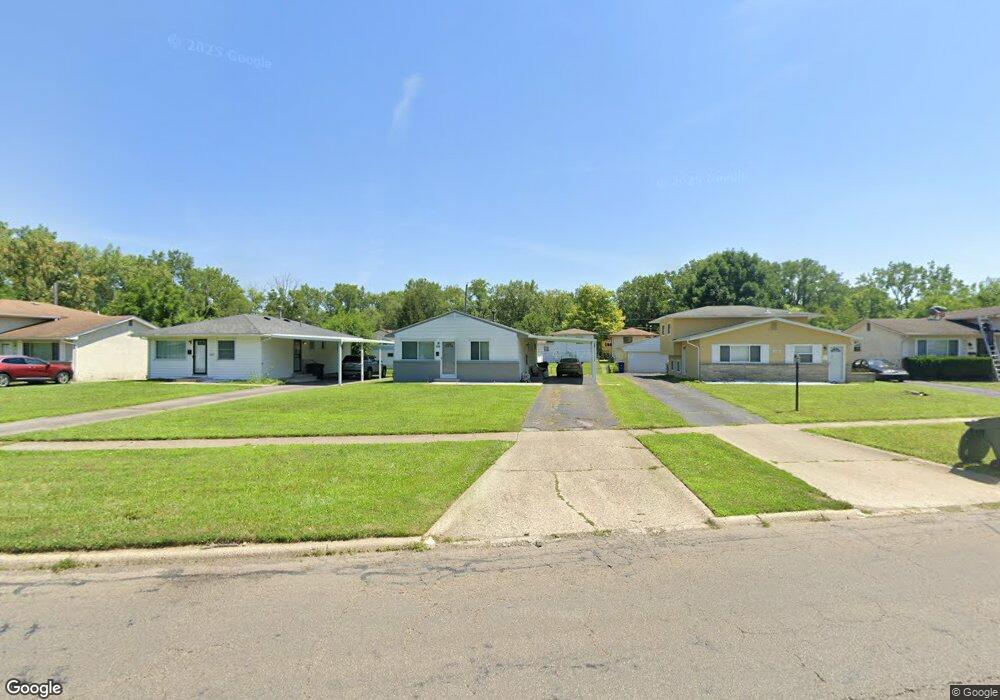
1654 Brentnell Ave Columbus, OH 43219
Brittany Hills NeighborhoodEstimated Value: $98,000 - $148,000
2
Beds
1
Bath
936
Sq Ft
$140/Sq Ft
Est. Value
About This Home
This home is located at 1654 Brentnell Ave, Columbus, OH 43219 and is currently estimated at $130,970, approximately $139 per square foot. 1654 Brentnell Ave is a home located in Franklin County with nearby schools including South Mifflin Stem Academy (K-6), Linden-Mckinley Stem School On Arcadia, and Cesar Chavez College Preparatory School.
Ownership History
Date
Name
Owned For
Owner Type
Purchase Details
Closed on
Apr 9, 2003
Sold by
Valentine Harold E
Bought by
Armstrong Ballard M and Armstrong Grace A
Current Estimated Value
Home Financials for this Owner
Home Financials are based on the most recent Mortgage that was taken out on this home.
Original Mortgage
$40,500
Interest Rate
5.87%
Purchase Details
Closed on
Dec 31, 2000
Sold by
Valentine Harold
Bought by
A L C A Llc
Home Financials for this Owner
Home Financials are based on the most recent Mortgage that was taken out on this home.
Original Mortgage
$38,000
Interest Rate
10%
Mortgage Type
Seller Take Back
Purchase Details
Closed on
Aug 8, 1988
Bought by
Valentine Harold E
Create a Home Valuation Report for This Property
The Home Valuation Report is an in-depth analysis detailing your home's value as well as a comparison with similar homes in the area
Home Values in the Area
Average Home Value in this Area
Purchase History
| Date | Buyer | Sale Price | Title Company |
|---|---|---|---|
| Armstrong Ballard M | $45,000 | Stewart Title Agency Of Colu | |
| A L C A Llc | $38,000 | -- | |
| Valentine Harold E | -- | -- |
Source: Public Records
Mortgage History
| Date | Status | Borrower | Loan Amount |
|---|---|---|---|
| Closed | Armstrong Ballard M | $56,500 | |
| Closed | Armstrong Ballard M | $40,500 | |
| Closed | A L C A Llc | $38,000 |
Source: Public Records
Tax History Compared to Growth
Tax History
| Year | Tax Paid | Tax Assessment Tax Assessment Total Assessment is a certain percentage of the fair market value that is determined by local assessors to be the total taxable value of land and additions on the property. | Land | Improvement |
|---|---|---|---|---|
| 2024 | $1,742 | $38,010 | $9,380 | $28,630 |
| 2023 | $1,720 | $38,010 | $9,380 | $28,630 |
| 2022 | $930 | $17,500 | $2,380 | $15,120 |
| 2021 | $932 | $17,500 | $2,380 | $15,120 |
| 2020 | $933 | $17,500 | $2,380 | $15,120 |
| 2019 | $857 | $13,790 | $1,890 | $11,900 |
| 2018 | $990 | $13,790 | $1,890 | $11,900 |
| 2017 | $1,046 | $13,790 | $1,890 | $11,900 |
| 2016 | $1,234 | $18,170 | $2,910 | $15,260 |
| 2015 | $1,124 | $18,170 | $2,910 | $15,260 |
| 2014 | $1,127 | $18,170 | $2,910 | $15,260 |
| 2013 | $617 | $20,160 | $3,220 | $16,940 |
Source: Public Records
Map
Nearby Homes
- 2228 Holt Ave
- 1790 Marston Rd
- 1789 Marston Rd
- 1808 Brentnell Ave
- 1794 Devonshire Rd
- 2363 Holt Ave
- 1978 Argyle Dr
- 1882 Dunning Rd
- 2424 Holt Ave
- 2398 Dunkirk Dr
- 2483 Vendome Dr
- 2336 Edenburgh Dr S
- 1367 Brookcliff Ave
- 1991 Woodland Ave
- 1275 Woodnell Ave
- 2054 Jermain Dr
- 0 Mock Rd
- 0 Bretton Rd Unit 225029828
- 2471 Mock Rd
- 0 Rankin Ave Unit (Rear)
- 1660 Brentnell Ave
- 1648 Brentnell Ave
- 1668 Brentnell Ave
- 1640 Brentnell Ave
- 1647 Deporres Dr
- 1639 Deporres Dr
- 1655 Deporres Dr
- 1630 Brentnell Ave
- 2177 Toni St
- 1631 Deporres Dr
- 1663 Deporres Dr
- 2187 Toni St
- 1651 Brentnell Ave
- 1657 Brentnell Ave
- 1643 Brentnell Ave
- 1623 Deporres Dr
- 1665 Brentnell Ave
- 1622 Brentnell Ave
- 1635 Brentnell Ave
- 1675 Deporres Dr