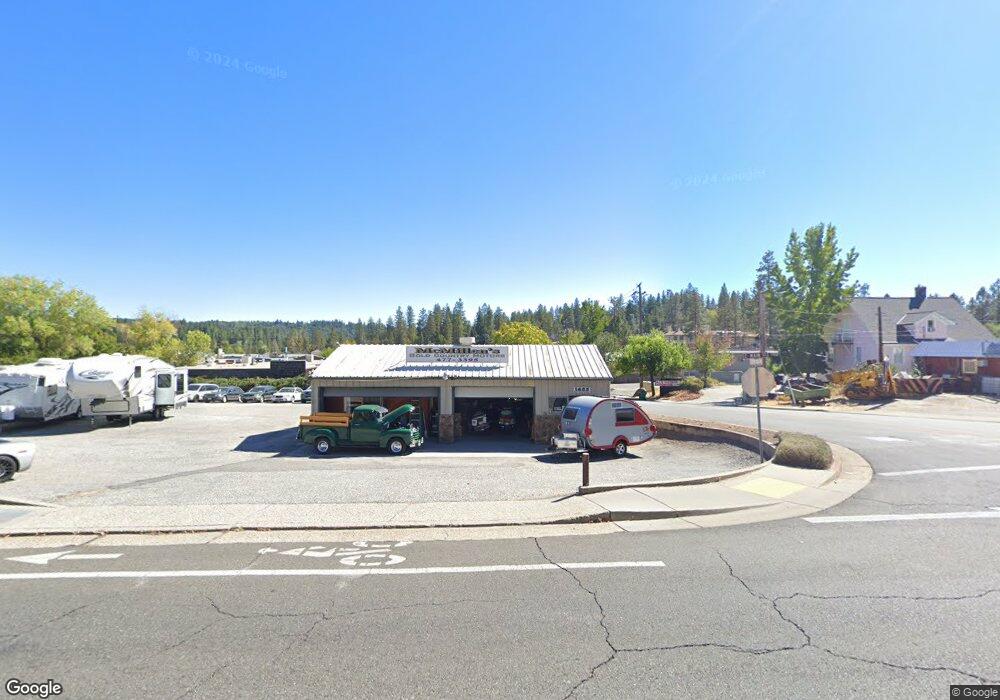
1655 E Main St Grass Valley, CA 95945
Studio
--
Bath
--
Sq Ft
22,216
Sq Ft
About This Home
This home is located at 1655 E Main St, Grass Valley, CA 95945. 1655 E Main St is a home located in Nevada County with nearby schools including Bell Hill Academy, Margaret G. Scotten Elementary School, and Lyman Gilmore Middle School.
Ownership History
Date
Name
Owned For
Owner Type
Purchase Details
Closed on
Oct 3, 2019
Sold by
Green Lawrence E and The Lawrence E Green Trust
Bought by
Meyers Kenneth J and Meyers Stephanie M
Home Financials for this Owner
Home Financials are based on the most recent Mortgage that was taken out on this home.
Original Mortgage
$230,000
Outstanding Balance
$201,077
Interest Rate
3.4%
Mortgage Type
Commercial
Purchase Details
Closed on
May 29, 2009
Sold by
Wikkeling Alfred H and Wikkeling Jeannette E
Bought by
Meyers Kenneth J and Meyers Stephanie M
Purchase Details
Closed on
Oct 26, 2005
Sold by
Wikkeling Aflred H
Bought by
Wikkeling Alfred H and Wikkeling Jeannette E
Purchase Details
Closed on
Jan 26, 2004
Sold by
Wikkeling Andrika A and Wikkeling Alfred H
Bought by
Wikkeling Fred H
Purchase Details
Closed on
Feb 18, 1998
Sold by
Wikkeling Cyril I and Wikkeling Andrika A
Bought by
Wikkeling Cyril I and Wikkeling Andrika A
Purchase Details
Closed on
Dec 10, 1997
Sold by
Wikkeling Cyril I and Wikkeling Andrika A
Bought by
Wikkeling Cyril L and Wikkeling Andrika A
Create a Home Valuation Report for This Property
The Home Valuation Report is an in-depth analysis detailing your home's value as well as a comparison with similar homes in the area
Home Values in the Area
Average Home Value in this Area
Purchase History
| Date | Buyer | Sale Price | Title Company |
|---|---|---|---|
| Meyers Kenneth J | $200,000 | Placer Title Company | |
| Meyers Kenneth J | $342,000 | Placer Title Company | |
| Wikkeling Alfred H | -- | -- | |
| Wikkeling Fred H | -- | -- | |
| Wikkeling Cyril I | -- | -- | |
| Wikkeling Cyril L | -- | -- |
Source: Public Records
Mortgage History
| Date | Status | Borrower | Loan Amount |
|---|---|---|---|
| Open | Meyers Kenneth J | $230,000 |
Source: Public Records
Tax History
| Year | Tax Paid | Tax Assessment Tax Assessment Total Assessment is a certain percentage of the fair market value that is determined by local assessors to be the total taxable value of land and additions on the property. | Land | Improvement |
|---|---|---|---|---|
| 2025 | $4,440 | $422,513 | $368,138 | $54,375 |
| 2024 | $4,334 | $414,229 | $360,920 | $53,309 |
| 2023 | $4,334 | $406,108 | $353,844 | $52,264 |
| 2022 | $4,296 | $415,001 | $364,041 | $50,960 |
| 2021 | $4,378 | $406,864 | $356,903 | $49,961 |
| 2020 | $4,347 | $402,693 | $353,244 | $49,449 |
| 2019 | $4,165 | $394,798 | $346,318 | $48,480 |
| 2018 | $0 | $387,058 | $339,528 | $47,530 |
| 2017 | $3,984 | $379,470 | $332,871 | $46,599 |
| 2016 | $3,836 | $372,031 | $326,345 | $45,686 |
| 2015 | $3,782 | $366,443 | $321,443 | $45,000 |
| 2014 | $3,725 | $359,266 | $315,147 | $44,119 |
Source: Public Records
Map
Nearby Homes
- 970 Laurel Ln
- 1025 Amber Loop
- 262 W Olympia Dr
- 975 Amber Loop
- 987 Pampas Dr
- 13055 Mulberry Dr
- 2300 Nevada City Hwy
- 136 Jackrabbit Rd
- 114 Jackrabbit Rd
- 118 Jackrabbit Rd
- 106 Jackrabbit Rd
- 110 Jackrabbit Rd
- 122 Jackrabbit Rd
- 126 Jackrabbit Rd
- 1576 Mulberry Dr
- 614 Cold Spring Ct
- 606 Cold Spring Ct
- 611 Cold Spring Ct
- 605 Cold Spring Ct
- 215 Mallard Dr
Your Personal Tour Guide
Ask me questions while you tour the home.