
Landlord's Agent in 2025
David Martin
Dickson Realty
(775) 284-4401
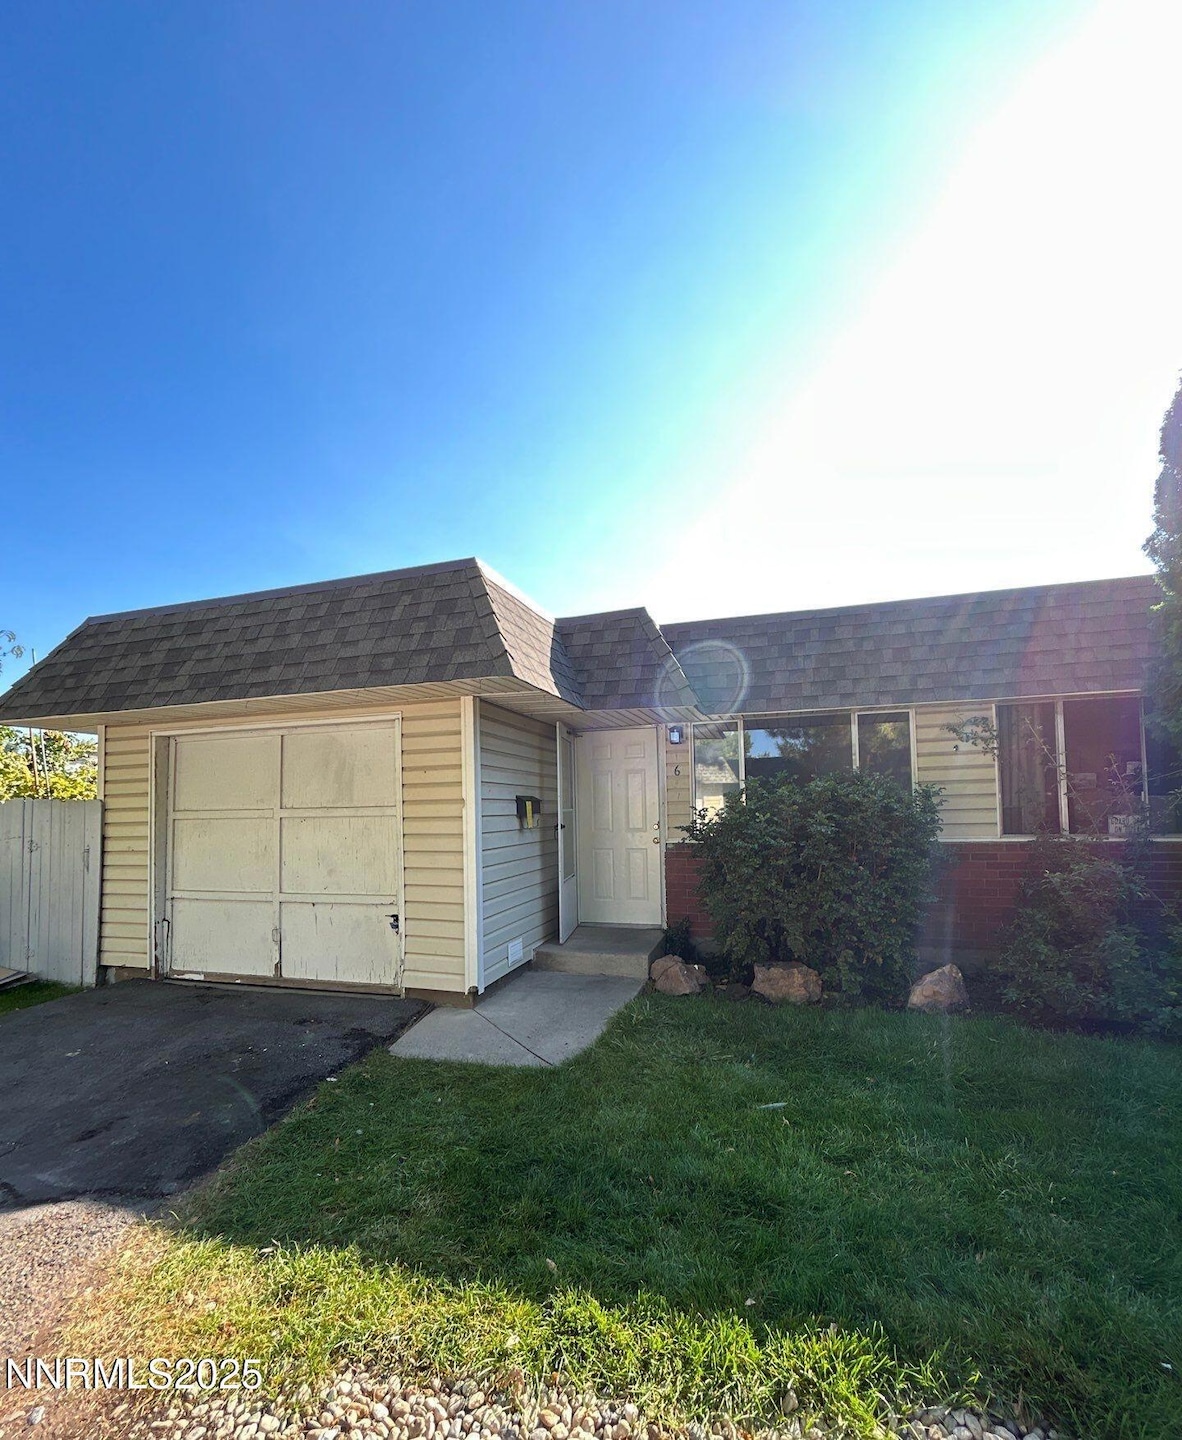
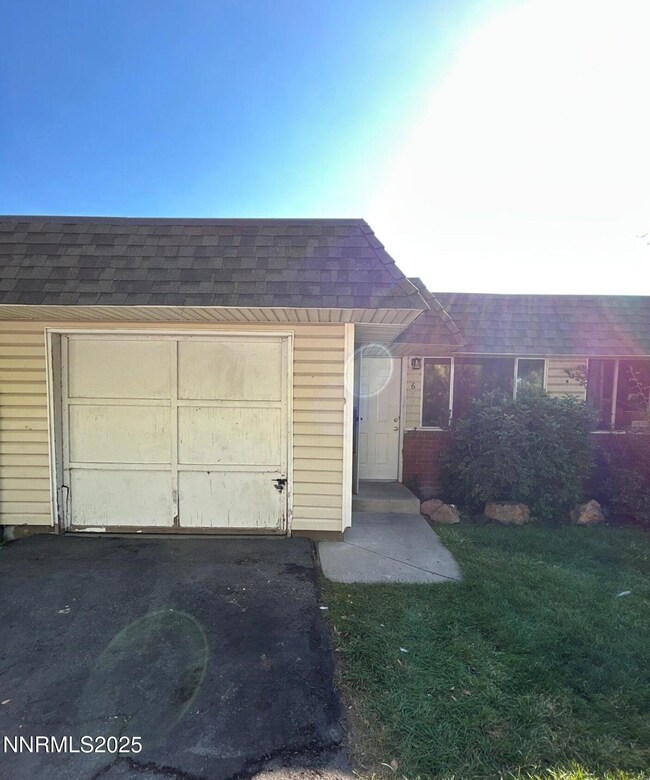
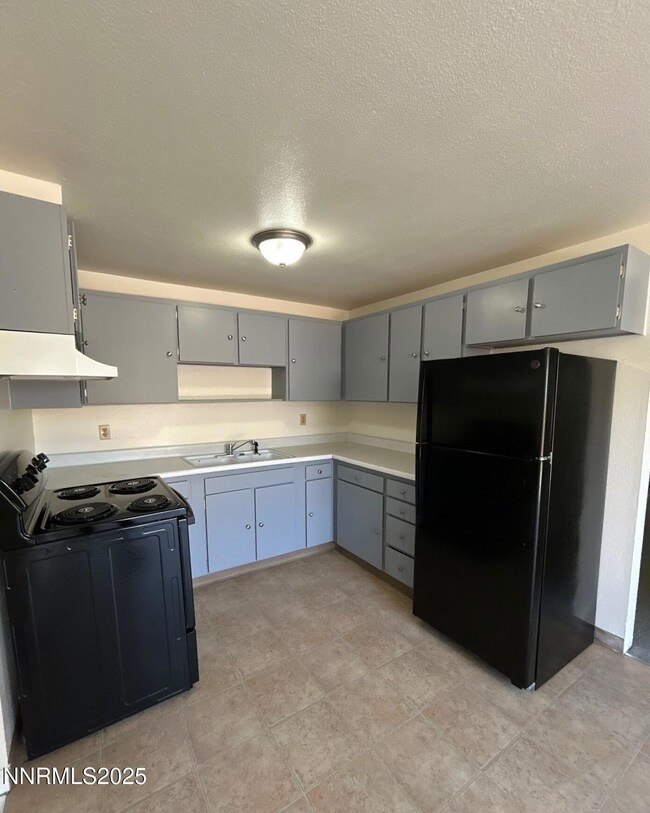
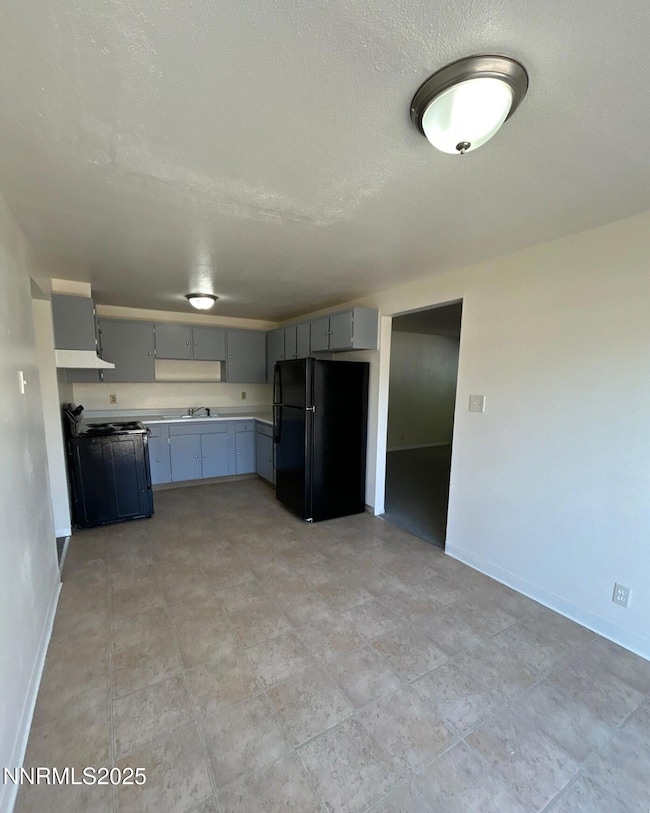
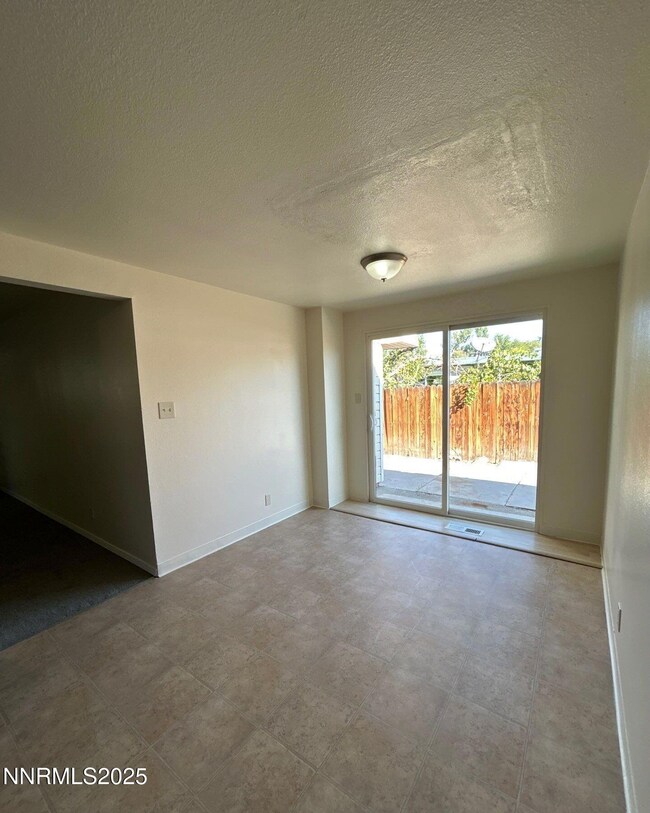
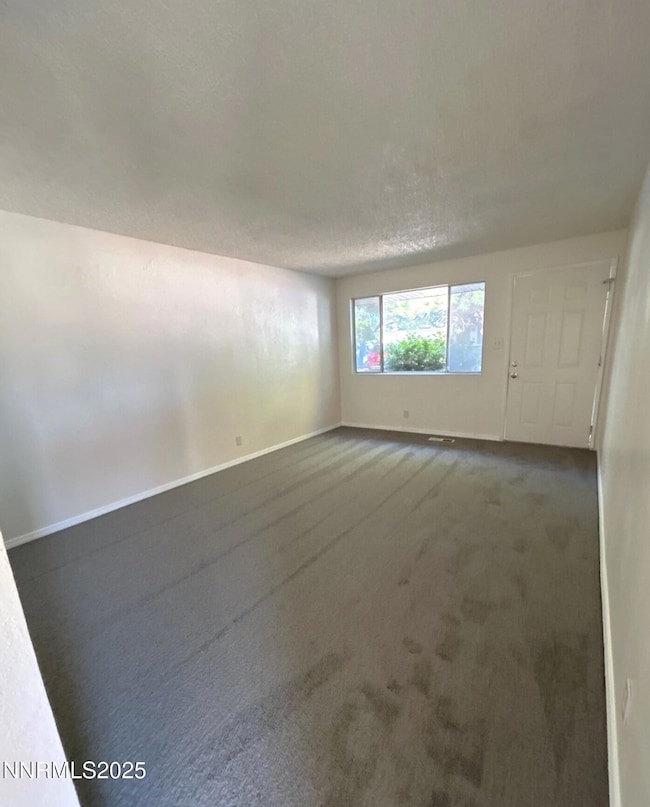
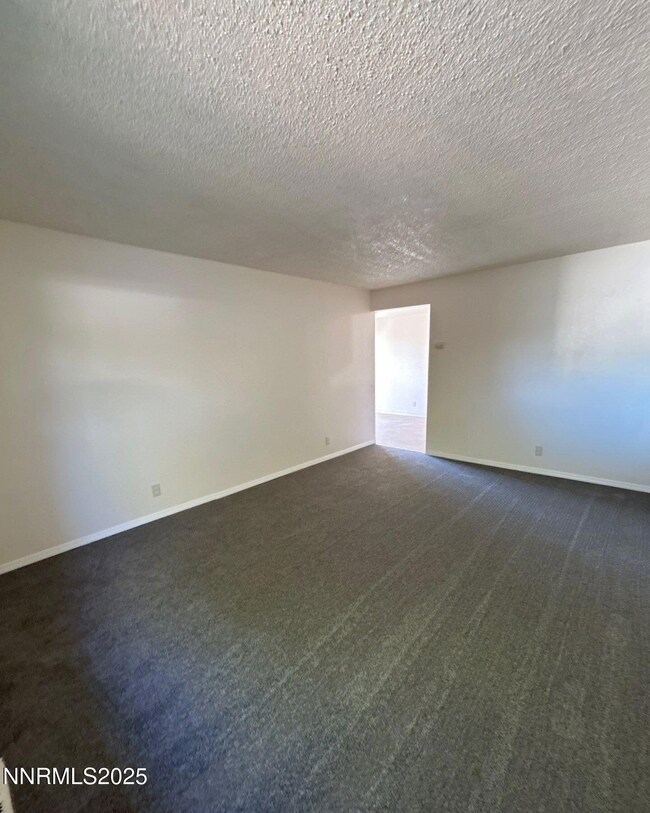
Available Now! Cozy townhouse in the heart of Sparks! This inviting home offers 3 bedrooms and 2 full bathrooms with a thoughtful layout that blends comfort and convenience. The charming kitchen includes a quaint dining area—perfect for enjoying your morning coffee or casual meals. Centrally located, this home is close to schools, parks, shopping, and dining. Commuting is a breeze with easy access to N. McCarran Blvd, Rock Blvd, the freeway, and nearby bus lines. For entertainment and community fun, Downtown Sparks is just a short drive away, offering year-round events, festivals, and activities for all to enjoy. Please note: pets are not allowed. Tenant Responsibilities & Fees Utilities: Tenants are responsible for all utilities. Garbage & Sewer: 89 Water and Power: tenants are responsible Rent: 1,500 Security Deposit: 1,600 One Time Administrative Fee: 195 All residents are enrolled in the Resident Benefits Package (RBP) for 55.00/month which includes liability insurance, credit building to help boost the resident's credit score with timely rent payments, up to 1M Identity Theft Protection, HVAC air filter delivery (for applicable properties), move-in concierge service making utility connection and home service setup a breeze during your move-in, our best-in-class resident rewards program, on-demand pest control, and much more! More details upon application.
Last Agent to Rent the Property
Dickson Realty - Sparks License #S.66470 Listed on: 09/16/2025
| Date | Buyer | Sale Price | Title Company |
|---|---|---|---|
| R & J Group I Llc | -- | -- |
| Date | Event | Price | List to Sale | Price per Sq Ft |
|---|---|---|---|---|
| 10/06/2025 10/06/25 | Rented | $1,500 | 0.0% | -- |
| 09/16/2025 09/16/25 | For Rent | $1,500 | -- | -- |
| Year | Tax Paid | Tax Assessment Tax Assessment Total Assessment is a certain percentage of the fair market value that is determined by local assessors to be the total taxable value of land and additions on the property. | Land | Improvement |
|---|---|---|---|---|
| 2025 | $627 | $40,592 | $27,370 | $13,222 |
| 2024 | $627 | $39,173 | $25,830 | $13,343 |
| 2023 | $609 | $34,149 | $22,645 | $11,504 |
| 2022 | $587 | $28,210 | $18,480 | $9,730 |
| 2021 | $574 | $21,366 | $11,830 | $9,536 |
| 2020 | $539 | $21,761 | $11,830 | $9,931 |
| 2019 | $523 | $22,026 | $12,040 | $9,986 |
| 2018 | $500 | $17,434 | $7,350 | $10,084 |
| 2017 | $480 | $16,926 | $6,720 | $10,206 |
| 2016 | $468 | $16,192 | $5,495 | $10,697 |
| 2015 | $467 | $15,652 | $4,445 | $11,207 |
| 2014 | $453 | $14,022 | $3,045 | $10,977 |
| 2013 | -- | $13,542 | $2,415 | $11,127 |
Landlord's Agent in 2025
David Martin
Dickson Realty
(775) 284-4401
Source: Northern Nevada Regional MLS
MLS Number: 250055947
APN: 027-033-47
Disclaimer: Certain information contained herein is derived from information provided by parties other than Homes.com. All information provided is deemed reliable, but is not guaranteed to be accurate and should be independently verified.
![]() IDX information is provided exclusively for personal, non-commercial use, and may not be used for any purpose other than to identify prospective properties consumers may be interested in purchasing. Information is deemed reliable but not guaranteed. The content relating to real estate for sale on this web site comes in part from the Broker Reciprocity/ IDX program of the Northern Nevada Regional Multiple Listing Service°. Real estate listings held by brokerage firms other than Ten-X are marked with the Broker Reciprocity logo and detailed information about those listings includes the name of the listing brokerage. Any use of the content other than by a search performed by a consumer looking to purchase or rent real estate is prohibited. © 2025 Northern Nevada Regional Multiple Listing Service® MLS. All rights reserved.
IDX information is provided exclusively for personal, non-commercial use, and may not be used for any purpose other than to identify prospective properties consumers may be interested in purchasing. Information is deemed reliable but not guaranteed. The content relating to real estate for sale on this web site comes in part from the Broker Reciprocity/ IDX program of the Northern Nevada Regional Multiple Listing Service°. Real estate listings held by brokerage firms other than Ten-X are marked with the Broker Reciprocity logo and detailed information about those listings includes the name of the listing brokerage. Any use of the content other than by a search performed by a consumer looking to purchase or rent real estate is prohibited. © 2025 Northern Nevada Regional Multiple Listing Service® MLS. All rights reserved.