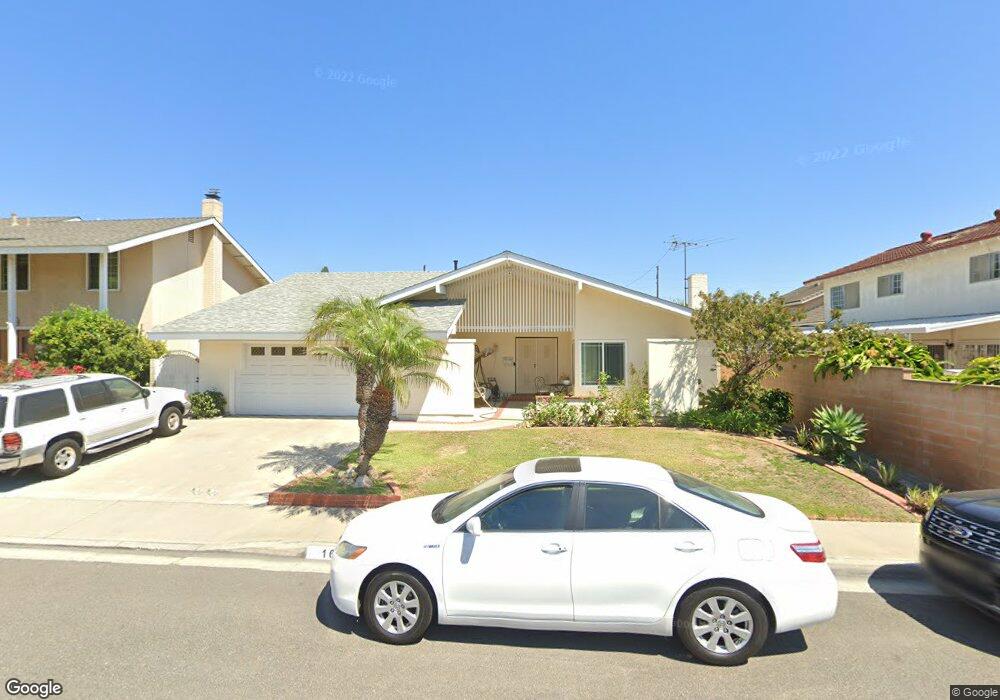
16572 Mount Cook Cir Fountain Valley, CA 92708
Estimated Value: $1,283,000 - $1,497,000
4
Beds
3
Baths
2,052
Sq Ft
$668/Sq Ft
Est. Value
About This Home
This home is located at 16572 Mount Cook Cir, Fountain Valley, CA 92708 and is currently estimated at $1,371,730, approximately $668 per square foot. 16572 Mount Cook Cir is a home located in Orange County with nearby schools including Mamie L. Northcutt Elementary School, Fitz Intermediate Language Academy, and Los Amigos High School.
Ownership History
Date
Name
Owned For
Owner Type
Purchase Details
Closed on
Mar 26, 2024
Sold by
Tran Thanh Cong and Vu Nhung Tuyet
Bought by
Thanh Tran And Nhung Vu Family Trust and Tran
Current Estimated Value
Purchase Details
Closed on
Nov 17, 2001
Sold by
Baccaro Ambrose
Bought by
Tran Thanh Cong and Vu Nhung Tuyet
Home Financials for this Owner
Home Financials are based on the most recent Mortgage that was taken out on this home.
Original Mortgage
$264,000
Interest Rate
7.01%
Purchase Details
Closed on
Oct 23, 2000
Sold by
Sprague Terry L
Bought by
Sprague Terry L and Sprague Jackie Elaine
Purchase Details
Closed on
Mar 3, 1997
Sold by
Vinci Maria J and Vinci Frank P
Bought by
Lisi Frank P and Lisi Maria J
Purchase Details
Closed on
Nov 3, 1986
Sold by
Lisi Frank
Bought by
Vinci Maria J and Lisi Frank P
Create a Home Valuation Report for This Property
The Home Valuation Report is an in-depth analysis detailing your home's value as well as a comparison with similar homes in the area
Home Values in the Area
Average Home Value in this Area
Purchase History
| Date | Buyer | Sale Price | Title Company |
|---|---|---|---|
| Thanh Tran And Nhung Vu Family Trust | -- | None Listed On Document | |
| Tran Thanh Cong | $330,000 | Chicago Title Co | |
| Sprague Terry L | -- | Orange Coast Title Company | |
| Lisi Frank P | -- | -- | |
| Vinci Maria J | -- | -- |
Source: Public Records
Mortgage History
| Date | Status | Borrower | Loan Amount |
|---|---|---|---|
| Previous Owner | Tran Thanh Cong | $264,000 | |
| Closed | Tran Thanh Cong | $25,000 |
Source: Public Records
Tax History Compared to Growth
Tax History
| Year | Tax Paid | Tax Assessment Tax Assessment Total Assessment is a certain percentage of the fair market value that is determined by local assessors to be the total taxable value of land and additions on the property. | Land | Improvement |
|---|---|---|---|---|
| 2025 | $6,239 | $551,005 | $348,404 | $202,601 |
| 2024 | $6,239 | $540,201 | $341,572 | $198,629 |
| 2023 | $6,123 | $529,609 | $334,874 | $194,735 |
| 2022 | $5,991 | $519,225 | $328,308 | $190,917 |
| 2021 | $5,929 | $509,045 | $321,871 | $187,174 |
| 2020 | $5,848 | $503,826 | $318,571 | $185,255 |
| 2019 | $5,733 | $493,948 | $312,325 | $181,623 |
| 2018 | $5,616 | $484,263 | $306,201 | $178,062 |
| 2017 | $5,540 | $474,768 | $300,197 | $174,571 |
| 2016 | $5,295 | $465,459 | $294,310 | $171,149 |
| 2015 | $5,220 | $458,468 | $289,889 | $168,579 |
| 2014 | $5,090 | $449,488 | $284,211 | $165,277 |
Source: Public Records
Map
Nearby Homes
- 11356 Stonecress Ave
- 16402 San Jacinto St
- 11872 Goodale Ave
- 11620 Warner Ave Unit 624
- 17168 Newhope St Unit 222
- 17200 Newhope St Unit 109
- 17200 Newhope St Unit 217
- 12062 W Edinger Ave Unit 19
- 12143 Sylvan River Unit 147
- 15880 Bogart Ct
- 17077 Los Modelos St
- 17288 San Lorenzo Cir
- 15890 Camo Bluff Ct
- 1080 S Harbor Blvd Unit 2
- 17401 Hood Ct
- 3510 & 3512 W Pine St
- 901 S Harmon St
- 12300 W Lilac Ave Unit 220
- 12300 W Lilac Ave Unit 714
- 10744 Lehnhardt Ave
- 16562 Mount Cook Cir
- 11431 Stonecress Ave
- 11445 Stonecress Ave
- 16573 Mount Shelly Cir
- 16550 Mount Cook Cir
- 16563 Mount Shelly Cir
- 11457 Stonecress Ave
- 16573 Mount Cook Cir
- 11407 Stonecress Ave
- 16551 Mount Shelly Cir
- 16563 Mount Cook Cir
- 16540 Mount Cook Cir
- 16551 Mount Cook Cir
- 16541 Mount Shelly Cir
- 11395 Stonecress Ave
- 11428 Stonecress Ave
- 11440 Stonecress Ave
- 11452 Stonecress Ave
- 11416 Stonecress Ave
- 16541 Mount Cook Cir