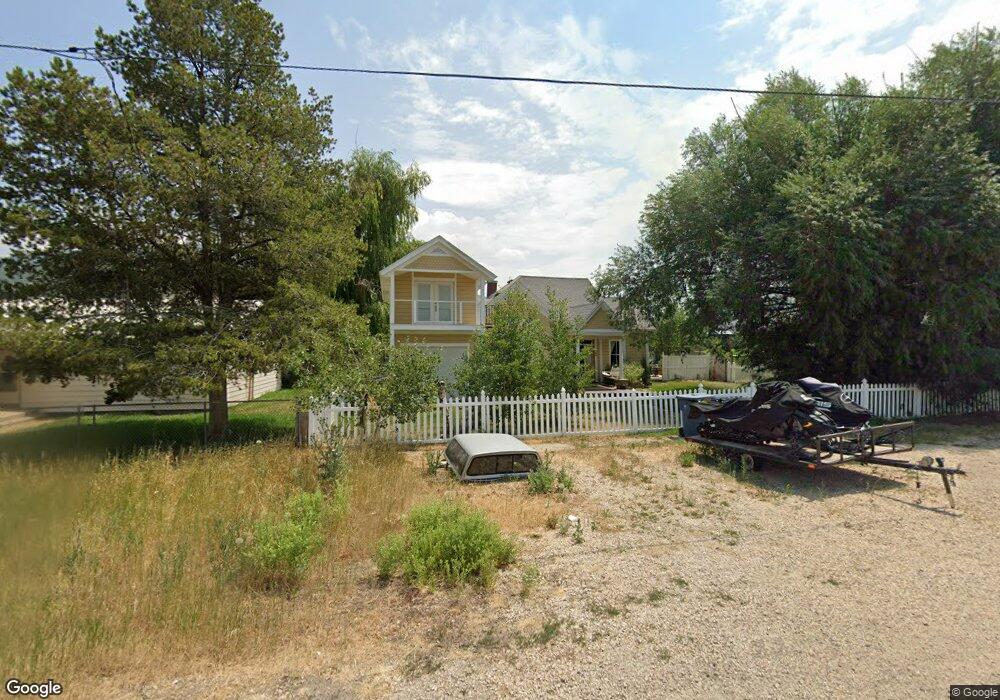
166 N 100 W Unit 2 Kamas, UT 84036
Kamas Valley NeighborhoodEstimated Value: $670,647 - $738,000
3
Beds
2
Baths
1,564
Sq Ft
$450/Sq Ft
Est. Value
About This Home
This home is located at 166 N 100 W Unit 2, Kamas, UT 84036 and is currently estimated at $703,662, approximately $449 per square foot. 166 N 100 W Unit 2 is a home located in Summit County with nearby schools including South Summit Elementary School and South Summit High School.
Ownership History
Date
Name
Owned For
Owner Type
Purchase Details
Closed on
Aug 13, 2020
Sold by
Wakeling David
Bought by
Peters Maxwell G and Peters Dean G
Current Estimated Value
Purchase Details
Closed on
Jun 7, 2016
Sold by
Wakeling Timothy and Wakeling David
Bought by
Wakeling David
Home Financials for this Owner
Home Financials are based on the most recent Mortgage that was taken out on this home.
Original Mortgage
$176,250
Interest Rate
3.66%
Mortgage Type
New Conventional
Purchase Details
Closed on
Nov 13, 2015
Sold by
Henderson Mark J and The M S E S Trust
Bought by
Wakeling Timothy and Wakeling David
Purchase Details
Closed on
Jan 11, 2010
Sold by
Sears Mike and Sears Beth
Bought by
Henderson Mark J
Purchase Details
Closed on
Sep 27, 2005
Sold by
Hodson Rachel
Bought by
Sears Mike and Sears Beth
Create a Home Valuation Report for This Property
The Home Valuation Report is an in-depth analysis detailing your home's value as well as a comparison with similar homes in the area
Home Values in the Area
Average Home Value in this Area
Purchase History
| Date | Buyer | Sale Price | Title Company |
|---|---|---|---|
| Peters Maxwell G | -- | Coalition Title Agnecy Inc | |
| Wakeling David | -- | Us Title Park City | |
| Wakeling Timothy | -- | First American Title | |
| Henderson Mark J | -- | -- | |
| Sears Mike | -- | Founders Title Company |
Source: Public Records
Mortgage History
| Date | Status | Borrower | Loan Amount |
|---|---|---|---|
| Previous Owner | Wakeling David | $176,250 |
Source: Public Records
Tax History Compared to Growth
Tax History
| Year | Tax Paid | Tax Assessment Tax Assessment Total Assessment is a certain percentage of the fair market value that is determined by local assessors to be the total taxable value of land and additions on the property. | Land | Improvement |
|---|---|---|---|---|
| 2024 | $3,094 | $540,550 | $170,000 | $370,550 |
| 2023 | $3,094 | $540,550 | $170,000 | $370,550 |
| 2022 | $2,801 | $434,025 | $120,000 | $314,025 |
| 2021 | $1,981 | $245,415 | $57,000 | $188,415 |
| 2020 | $2,092 | $239,135 | $57,000 | $182,135 |
| 2019 | $1,163 | $119,434 | $31,350 | $88,084 |
| 2018 | $1,020 | $109,071 | $31,350 | $77,721 |
| 2017 | $822 | $89,359 | $22,000 | $67,359 |
| 2016 | $861 | $89,359 | $22,000 | $67,359 |
| 2015 | $1,555 | $157,544 | $0 | $0 |
| 2013 | $1,660 | $157,544 | $0 | $0 |
Source: Public Records
Map
Nearby Homes
- 325 N Main St
- 310 N 100 W
- 263 W 360 N
- 155 Hawthorne Dr
- 3981 E Harris Way Unit 151
- 3732 E Huntley Way
- 3732 E Huntley Way Unit 61
- 385 Hawthorne Dr
- 481 Thorn View Ct Unit 6
- 886 Wasatch View Dr Unit 12
- 1090 Wasatch View Dr Unit 16
- 883 Wasatch View Dr Unit 11
- 0 Utah 248
- 1156 Wasatch View Dr Unit 17
- 1228 Wasatch View Dr Unit 18
- 272 Thorn Creek Dr
- 1165 Wasatch View Dr Unit 3
- 1121 Wasatch View Dr Unit 4
- 342 S 125 W
- 375 Thorn Creek Dr