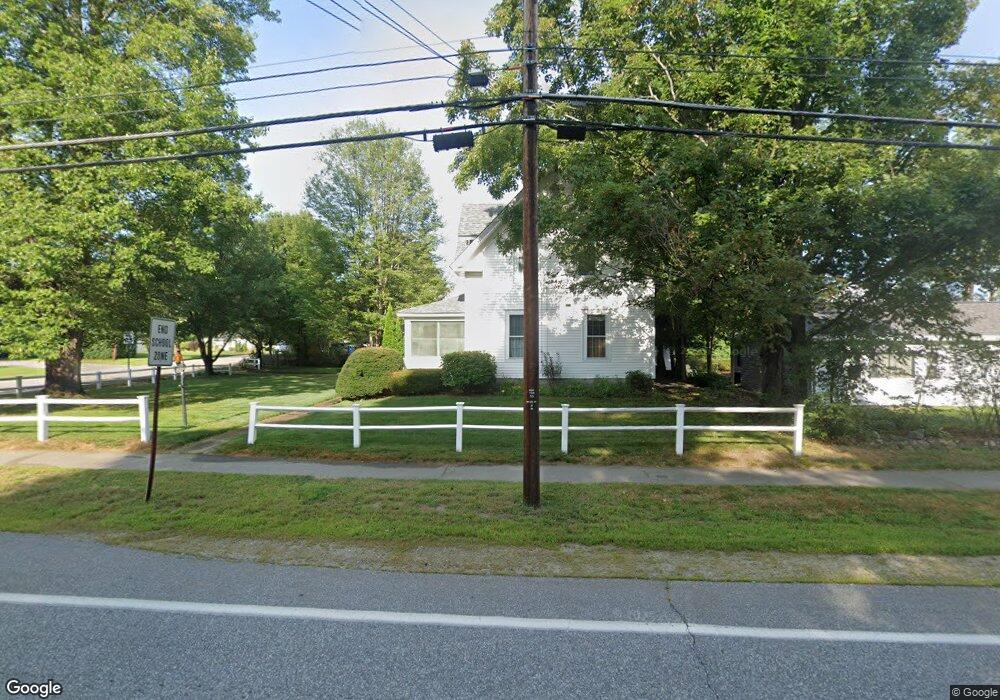
166 South St Concord, NH 03301
South End NeighborhoodEstimated Value: $487,506 - $535,000
4
Beds
2
Baths
1,480
Sq Ft
$344/Sq Ft
Est. Value
About This Home
This home is located at 166 South St, Concord, NH 03301 and is currently estimated at $508,877, approximately $343 per square foot. 166 South St is a home located in Merrimack County with nearby schools including Abbot-Downing School, Rundlett Middle School, and Concord High School.
Ownership History
Date
Name
Owned For
Owner Type
Purchase Details
Closed on
Aug 31, 2007
Sold by
Duval Jennie V
Bought by
Kuzma Jennifer L
Current Estimated Value
Home Financials for this Owner
Home Financials are based on the most recent Mortgage that was taken out on this home.
Original Mortgage
$246,900
Interest Rate
6.71%
Mortgage Type
Purchase Money Mortgage
Purchase Details
Closed on
Jan 4, 2002
Sold by
Ryan Mary Y
Bought by
Bedard Jennie V and Bedard Gerard R
Home Financials for this Owner
Home Financials are based on the most recent Mortgage that was taken out on this home.
Original Mortgage
$139,600
Interest Rate
6.72%
Mortgage Type
Purchase Money Mortgage
Create a Home Valuation Report for This Property
The Home Valuation Report is an in-depth analysis detailing your home's value as well as a comparison with similar homes in the area
Home Values in the Area
Average Home Value in this Area
Purchase History
| Date | Buyer | Sale Price | Title Company |
|---|---|---|---|
| Kuzma Jennifer L | $259,900 | -- | |
| Bedard Jennie V | $174,500 | -- |
Source: Public Records
Mortgage History
| Date | Status | Borrower | Loan Amount |
|---|---|---|---|
| Open | Bedard Jennie V | $236,700 | |
| Closed | Bedard Jennie V | $246,900 | |
| Previous Owner | Bedard Jennie V | $139,600 |
Source: Public Records
Tax History
| Year | Tax Paid | Tax Assessment Tax Assessment Total Assessment is a certain percentage of the fair market value that is determined by local assessors to be the total taxable value of land and additions on the property. | Land | Improvement |
|---|---|---|---|---|
| 2025 | $9,391 | $322,600 | $122,900 | $199,700 |
| 2024 | $8,933 | $322,600 | $122,900 | $199,700 |
| 2023 | $8,665 | $322,600 | $122,900 | $199,700 |
| 2022 | $8,352 | $322,600 | $122,900 | $199,700 |
| 2021 | $8,096 | $322,300 | $122,600 | $199,700 |
| 2020 | $7,827 | $292,500 | $96,500 | $196,000 |
| 2019 | $7,420 | $267,100 | $100,300 | $166,800 |
| 2018 | $7,265 | $257,700 | $100,600 | $157,100 |
| 2017 | $6,992 | $247,600 | $100,600 | $147,000 |
| 2016 | $6,638 | $239,900 | $98,700 | $141,200 |
| 2015 | $6,296 | $214,300 | $89,300 | $125,000 |
| 2014 | $5,745 | $214,300 | $89,300 | $125,000 |
| 2013 | -- | $214,300 | $89,300 | $125,000 |
| 2012 | -- | $219,200 | $89,300 | $129,900 |
Source: Public Records
Map
Nearby Homes
- 0 South St Unit 4969509
- 47 Noyes St
- 335 S Main St
- 33 Joffre St
- 273-279 S Main St
- 40 Nivelle St
- 289 South St
- 47 South St
- 58 S State St
- 111 -113 South Main St
- 7-9 Myrtle St
- 30 Longmeadow Dr
- 25 N Spring St
- 9 Forest St
- 135 Liberty St
- 22 Fairfield Dr
- 21 Fairfield Dr
- 20 Fairfield Dr
- 5 Holly Cir
- 5 Windchime Dr
Your Personal Tour Guide
Ask me questions while you tour the home.