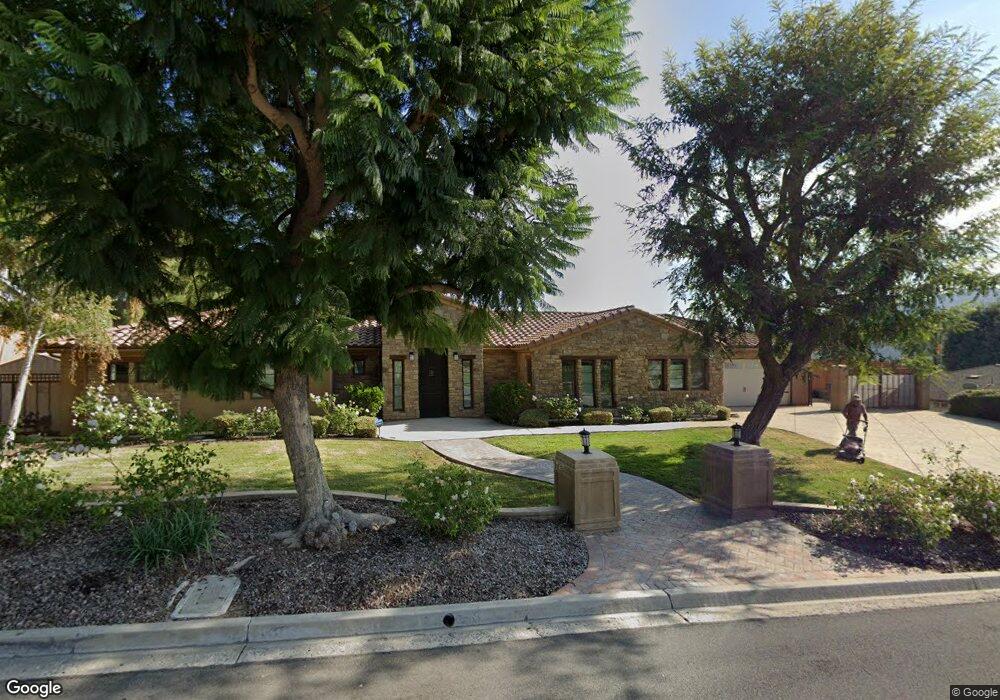
1660 San Rafael Way Camarillo, CA 93012
Estimated Value: $1,542,611 - $1,657,000
3
Beds
4
Baths
2,399
Sq Ft
$675/Sq Ft
Est. Value
About This Home
This home is located at 1660 San Rafael Way, Camarillo, CA 93012 and is currently estimated at $1,619,653, approximately $675 per square foot. 1660 San Rafael Way is a home located in Ventura County with nearby schools including Tierra Linda Elementary School, Las Colinas Middle School, and Adolfo Camarillo High School.
Ownership History
Date
Name
Owned For
Owner Type
Purchase Details
Closed on
Oct 21, 2009
Sold by
Ellias Diane J and Ellias Michael
Bought by
Ellias Michael A and Ellias Diane J
Current Estimated Value
Purchase Details
Closed on
Aug 21, 2009
Sold by
Billups Ellias Diane J and Billups Diane J
Bought by
Billups Ellias Diane J and Ellias Michael
Purchase Details
Closed on
Aug 5, 2005
Sold by
Billups William C and Billups Diane J
Bought by
Billups Diane J
Purchase Details
Closed on
Mar 24, 2005
Sold by
Billups Dianne J
Bought by
Billups Diane J
Home Financials for this Owner
Home Financials are based on the most recent Mortgage that was taken out on this home.
Original Mortgage
$282,000
Interest Rate
5.62%
Mortgage Type
Purchase Money Mortgage
Purchase Details
Closed on
Jul 16, 2004
Sold by
Billups William C
Bought by
Billups Diane J
Purchase Details
Closed on
Jun 8, 2001
Sold by
Billups William C and Billups Diane J
Bought by
Billups William C and Billups Diane J
Create a Home Valuation Report for This Property
The Home Valuation Report is an in-depth analysis detailing your home's value as well as a comparison with similar homes in the area
Home Values in the Area
Average Home Value in this Area
Purchase History
| Date | Buyer | Sale Price | Title Company |
|---|---|---|---|
| Ellias Michael A | -- | None Available | |
| Billups Ellias Diane J | -- | None Available | |
| Billups Diane J | -- | -- | |
| Billups Diane J | -- | Fidelity National Title Co | |
| Billups Diane J | -- | -- | |
| Billups William C | -- | -- | |
| Billups William C | -- | -- |
Source: Public Records
Mortgage History
| Date | Status | Borrower | Loan Amount |
|---|---|---|---|
| Closed | Billups Diane J | $282,000 |
Source: Public Records
Tax History Compared to Growth
Tax History
| Year | Tax Paid | Tax Assessment Tax Assessment Total Assessment is a certain percentage of the fair market value that is determined by local assessors to be the total taxable value of land and additions on the property. | Land | Improvement |
|---|---|---|---|---|
| 2025 | $10,199 | $938,330 | $263,239 | $675,091 |
| 2024 | $10,199 | $919,932 | $258,078 | $661,854 |
| 2023 | $9,832 | $901,895 | $253,018 | $648,877 |
| 2022 | $9,802 | $884,211 | $248,057 | $636,154 |
| 2021 | $9,448 | $866,874 | $243,193 | $623,681 |
| 2020 | $9,414 | $857,987 | $240,700 | $617,287 |
| 2019 | $9,371 | $841,165 | $235,981 | $605,184 |
| 2018 | $9,198 | $824,672 | $231,354 | $593,318 |
| 2017 | $8,654 | $808,503 | $226,818 | $581,685 |
| 2016 | $8,445 | $792,651 | $222,371 | $570,280 |
| 2015 | $8,356 | $780,747 | $219,032 | $561,715 |
| 2014 | $8,159 | $765,456 | $214,743 | $550,713 |
Source: Public Records
Map
Nearby Homes
- 41045 Village 41
- 37134 Village 37
- 37203 Village 37
- 1809 Via Montecito
- 35124 Village 35
- 40036 Village 40 Unit 40
- 6169 Arabian Place
- 1575 Frazier St
- 2124 Cervato Dr
- 35206 Village 35 Unit 35
- 40019 Village 40 Unit 40
- 33229 Village 33
- 5930 Heritage Place
- 6047 Shasta Place
- 33208 Village 33 Unit 33
- 33119 Village 33 Unit 33
- 34135 Village 34
- 31328 Village 31
- 31310 Village 31 Unit 31
- 6146 Palomar Cir
- 1638 San Rafael Way
- 1686 San Rafael Way
- 1791 Cervato Dr
- 1797 Cervato Dr
- 1612 San Rafael Way
- 1661 San Rafael Way
- 1639 San Rafael Way
- 1775 Cervato Dr
- 1687 San Rafael Way
- 1615 San Rafael Way
- 1702 San Rafael Way
- 1586 San Rafael Way
- 1767 Cervato Dr
- 1692 San Rafael Way
- 1587 San Rafael Way
- 1782 Cervato Dr
- 1796 Cervato Dr
- 6613 Santa Rosa Rd
- 1759 Cervato Dr
- 1560 San Rafael Way