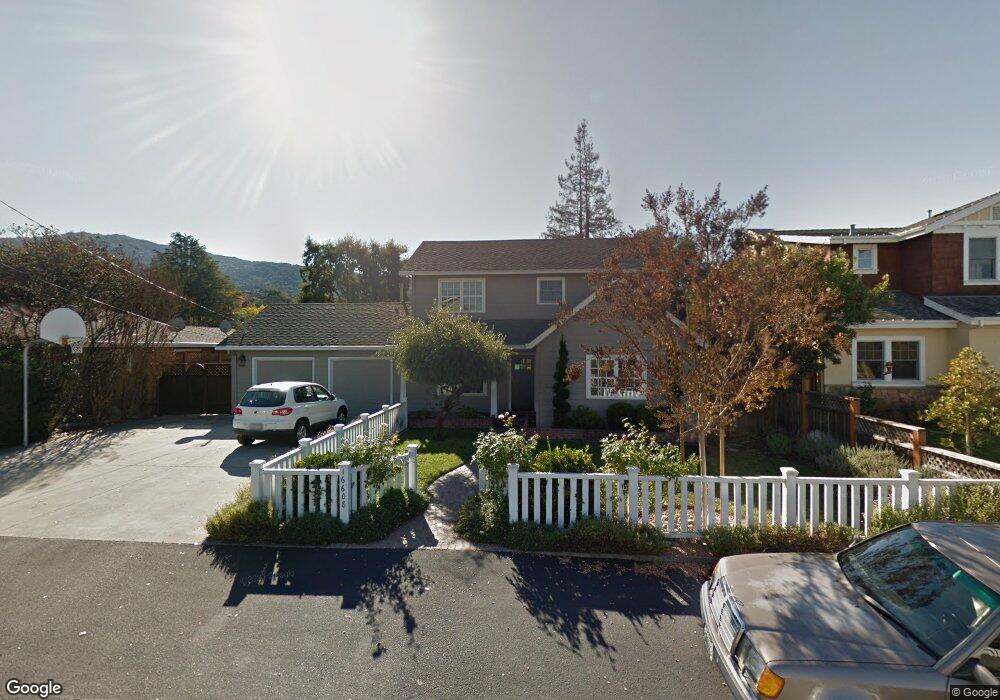
16608 Topping Way Los Gatos, CA 95032
East Los Gatos NeighborhoodEstimated Value: $3,134,000 - $3,908,000
5
Beds
3
Baths
964
Sq Ft
$3,618/Sq Ft
Est. Value
About This Home
This home is located at 16608 Topping Way, Los Gatos, CA 95032 and is currently estimated at $3,488,202, approximately $3,618 per square foot. 16608 Topping Way is a home located in Santa Clara County with nearby schools including Blossom Hill Elementary School, Loma Prieta Elementary School, and Raymond J. Fisher Middle School.
Ownership History
Date
Name
Owned For
Owner Type
Purchase Details
Closed on
Jan 7, 2020
Sold by
Seandel Stephen D and Seandel Suzanne M
Bought by
Seandel Stephen D and Seandel Suzanne M
Current Estimated Value
Home Financials for this Owner
Home Financials are based on the most recent Mortgage that was taken out on this home.
Original Mortgage
$798,000
Outstanding Balance
$694,743
Interest Rate
2.87%
Mortgage Type
New Conventional
Estimated Equity
$2,793,459
Purchase Details
Closed on
Oct 11, 2011
Sold by
Seandel Stephen D and Seandel Suzanne M
Bought by
Seandel Stephen D and Seandel Suzanne M
Purchase Details
Closed on
Jan 5, 2001
Sold by
Schultheis Gary R And Tamara L Trustee
Bought by
Seandel Stephen D and Seandel Suzanne M
Home Financials for this Owner
Home Financials are based on the most recent Mortgage that was taken out on this home.
Original Mortgage
$1,000,000
Interest Rate
7.37%
Purchase Details
Closed on
Dec 10, 1999
Sold by
Schultheis Gary R and Schultheis Tamara L
Bought by
Schultheis Gary R and Schultheis Tamara L
Create a Home Valuation Report for This Property
The Home Valuation Report is an in-depth analysis detailing your home's value as well as a comparison with similar homes in the area
Home Values in the Area
Average Home Value in this Area
Purchase History
| Date | Buyer | Sale Price | Title Company |
|---|---|---|---|
| Seandel Stephen D | -- | Amrock Inc | |
| Seandel Stephen D | -- | None Available | |
| Seandel Stephen D | $1,399,000 | North American Title Co | |
| Schultheis Gary R | -- | -- |
Source: Public Records
Mortgage History
| Date | Status | Borrower | Loan Amount |
|---|---|---|---|
| Open | Seandel Stephen D | $798,000 | |
| Closed | Seandel Stephen D | $1,000,000 | |
| Closed | Seandel Stephen D | $100,000 |
Source: Public Records
Tax History Compared to Growth
Tax History
| Year | Tax Paid | Tax Assessment Tax Assessment Total Assessment is a certain percentage of the fair market value that is determined by local assessors to be the total taxable value of land and additions on the property. | Land | Improvement |
|---|---|---|---|---|
| 2025 | $25,448 | $2,195,523 | $1,506,843 | $688,680 |
| 2024 | $25,448 | $2,152,475 | $1,477,298 | $675,177 |
| 2023 | $25,001 | $2,110,271 | $1,448,332 | $661,939 |
| 2022 | $24,839 | $2,068,894 | $1,419,934 | $648,960 |
| 2021 | $24,433 | $2,028,329 | $1,392,093 | $636,236 |
| 2020 | $24,003 | $2,007,532 | $1,377,819 | $629,713 |
| 2019 | $23,739 | $1,968,169 | $1,350,803 | $617,366 |
| 2018 | $23,413 | $1,929,578 | $1,324,317 | $605,261 |
| 2017 | $23,360 | $1,891,744 | $1,298,350 | $593,394 |
| 2016 | $22,766 | $1,854,652 | $1,272,893 | $581,759 |
| 2015 | $22,632 | $1,826,794 | $1,253,773 | $573,021 |
| 2014 | $22,294 | $1,791,011 | $1,229,214 | $561,797 |
Source: Public Records
Map
Nearby Homes
- 105 Via Santa Maria
- 16460 B Bonnie Ln
- 120 Pinta Ct
- 170 Twin Oaks Dr
- 16760 Magneson Loop
- 0 Twin Oaks Dr Unit ML81936703
- 16497 S Kennedy Rd
- 115 Lansberry Ct
- 16244 Kennedy Rd
- 256 Los Gatos Blvd
- 15985 Shannon Rd
- 451 Alberto Way Unit 151
- 420 Alberto Way Unit 5
- 449 Alberto Way Unit C139
- 17435 Phillips Ave
- 443 Alberto Way Unit B115
- 443 Alberto Way Unit B121
- 435 Alberto Way Unit 17
- 220 Milbrae Ln Unit 6
- 16840 Cypress Way
- 16622 Topping Way
- 16594 Topping Way
- 16619 Marchmont Dr
- 16603 Marchmont Dr
- 16580 Topping Way
- 16636 Topping Way
- 16635 Marchmont Dr
- 16587 Marchmont Dr
- 16597 Topping Way
- 16611 Topping Way
- 16585 Topping Way
- 16651 Marchmont Dr
- 16650 Topping Way
- 16566 Topping Way
- 16625 Topping Way
- 16571 Marchmont Dr
- 16571 Topping Way
- 16647 Topping Way
- 16667 Marchmont Dr
- 16552 Topping Way