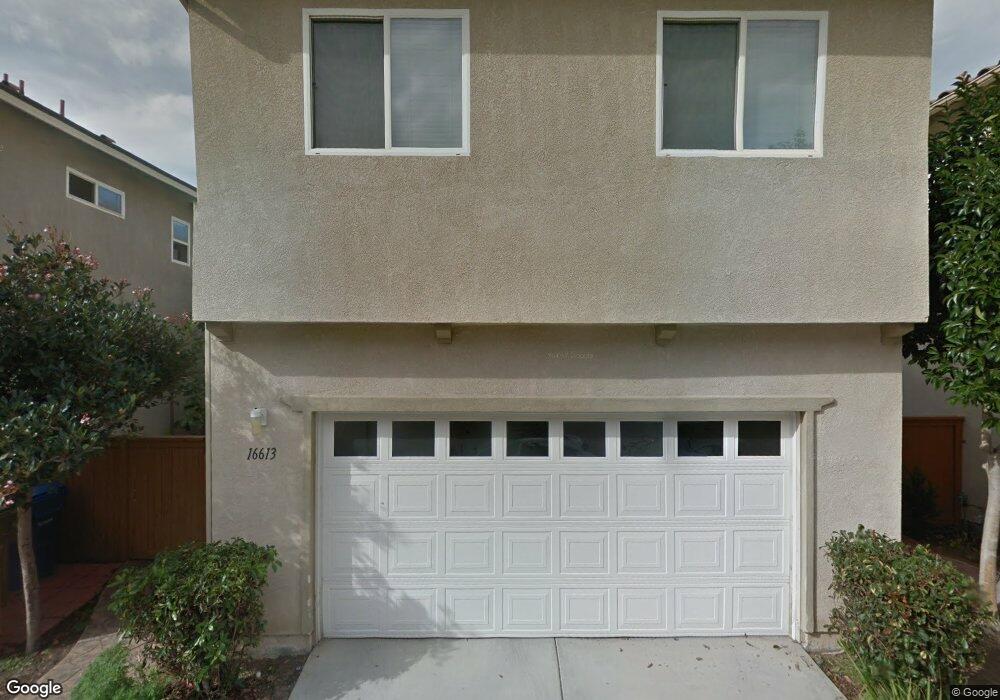
16613 Deer Ridge Rd San Diego, CA 92127
4S Ranch NeighborhoodEstimated Value: $1,223,000 - $1,406,000
3
Beds
3
Baths
1,931
Sq Ft
$673/Sq Ft
Est. Value
About This Home
This home is located at 16613 Deer Ridge Rd, San Diego, CA 92127 and is currently estimated at $1,299,582, approximately $673 per square foot. 16613 Deer Ridge Rd is a home located in San Diego County with nearby schools including Stone Ranch Elementary, Oak Valley Middle, and Del Norte High School.
Ownership History
Date
Name
Owned For
Owner Type
Purchase Details
Closed on
Jul 13, 2009
Sold by
Truong Tung Huu and Truong Toni I Wuei
Bought by
Ponnath Santhosh K and Sarojiniamma Suja
Current Estimated Value
Home Financials for this Owner
Home Financials are based on the most recent Mortgage that was taken out on this home.
Original Mortgage
$417,000
Outstanding Balance
$255,248
Interest Rate
4.12%
Mortgage Type
Purchase Money Mortgage
Estimated Equity
$1,044,334
Purchase Details
Closed on
Mar 20, 2003
Sold by
4S Lots 2 & 8 Llc
Bought by
Truong Tung Huu and Truong Toni I Wuei
Home Financials for this Owner
Home Financials are based on the most recent Mortgage that was taken out on this home.
Original Mortgage
$322,700
Interest Rate
5.37%
Mortgage Type
Purchase Money Mortgage
Create a Home Valuation Report for This Property
The Home Valuation Report is an in-depth analysis detailing your home's value as well as a comparison with similar homes in the area
Home Values in the Area
Average Home Value in this Area
Purchase History
| Date | Buyer | Sale Price | Title Company |
|---|---|---|---|
| Ponnath Santhosh K | $534,000 | North American Title Company | |
| Truong Tung Huu | $434,000 | Chicago Title Co |
Source: Public Records
Mortgage History
| Date | Status | Borrower | Loan Amount |
|---|---|---|---|
| Open | Ponnath Santhosh K | $417,000 | |
| Previous Owner | Truong Tung Huu | $322,700 | |
| Closed | Truong Tung Huu | $67,700 |
Source: Public Records
Tax History Compared to Growth
Tax History
| Year | Tax Paid | Tax Assessment Tax Assessment Total Assessment is a certain percentage of the fair market value that is determined by local assessors to be the total taxable value of land and additions on the property. | Land | Improvement |
|---|---|---|---|---|
| 2025 | $11,586 | $689,279 | $348,512 | $340,767 |
| 2024 | $11,586 | $675,765 | $341,679 | $334,086 |
| 2023 | $11,403 | $662,516 | $334,980 | $327,536 |
| 2022 | $11,197 | $649,526 | $328,412 | $321,114 |
| 2021 | $10,977 | $636,791 | $321,973 | $314,818 |
| 2020 | $10,737 | $630,262 | $318,672 | $311,590 |
| 2019 | $10,587 | $617,905 | $312,424 | $305,481 |
| 2018 | $10,250 | $605,791 | $306,299 | $299,492 |
| 2017 | $9,815 | $593,914 | $300,294 | $293,620 |
| 2016 | $9,610 | $582,269 | $294,406 | $287,863 |
| 2015 | $9,583 | $573,524 | $289,984 | $283,540 |
| 2014 | -- | $562,290 | $284,304 | $277,986 |
Source: Public Records
Map
Nearby Homes
- 9955 Fieldthorn St Unit T78
- 16488 Fox Valley Dr
- 16174 Deer Ridge Ct
- Lot #1 Trailside Ln
- Lot #2 Trailside Ln
- Artesian Rd & Camino Lima (Corner Lot 34)
- Artesian Rd Camino Lima Parcel 33
- Artesian Rd & Camino Lima Parcel -32
- Artesian Rd & End of Camino Lima
- 15105 Lincoln Loop
- 16162 Veridian Cir
- 16222 Veridian Cir
- 16206 Veridian Cir
- 15929 Parkview Loop
- 16935 Laurel Hill Ln Unit 171
- 10551 Sanshey Ln Unit 132
- 10482 Hollingsworth Way Unit 187
- 10659 Paseo Allegria Ave
- 16636 Gill Loop
- 16750 Coyote Bush Dr Unit 31
- 16639 Deer Ridge Rd Unit 54
- 9820 Lone Quail Rd Unit 64
- 16609 Deer Ridge Rd Unit 60
- 16627 Deer Ridge Rd Unit 56
- 9836 Lone Quail Rd
- 9828 Lone Quail Rd
- 9812 Lone Quail Rd
- 16605 Deer Ridge Rd Unit 61
- 16617 Deer Ridge Rd
- 16621 Deer Ridge Rd
- 16633 Deer Ridge Rd
- 16618 Deer Ridge Rd
- 16626 Deer Ridge Rd
- 16610 Deer Ridge Rd
- 16634 Deer Ridge Rd
- 16642 Deer Ridge Rd
- 9935 Antietam Rd Unit 77
- 9921 Antietam Rd Unit 76
- 9907 Antietam Rd Unit 75
- 9938 Stockbridge Rd Unit 72