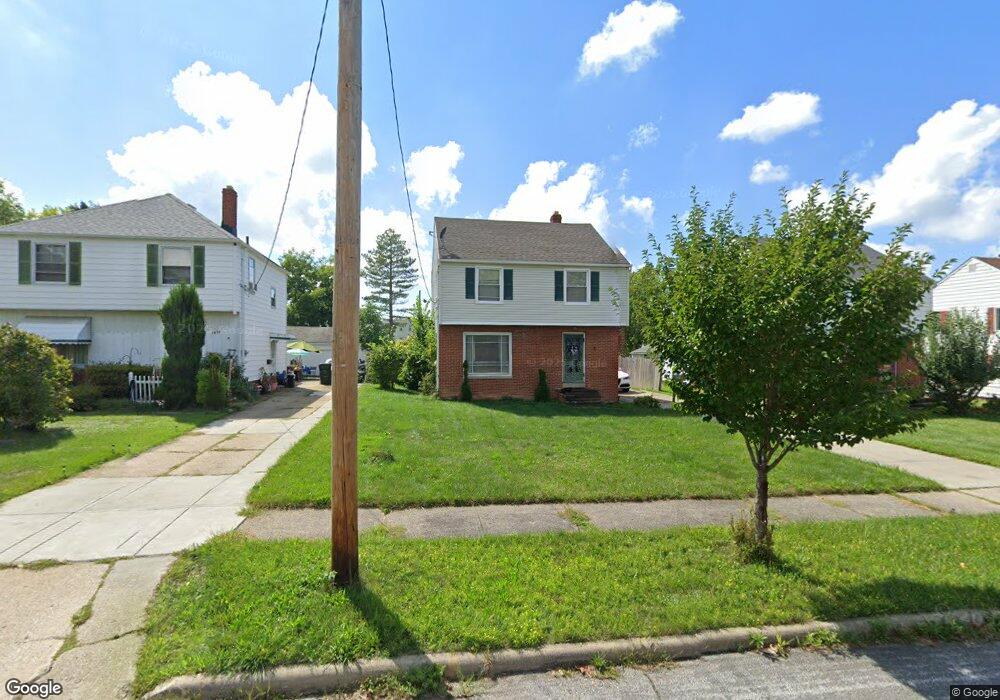
1664 E 276th St Euclid, OH 44132
Estimated Value: $106,507 - $154,000
4
Beds
2
Baths
1,250
Sq Ft
$108/Sq Ft
Est. Value
About This Home
This home is located at 1664 E 276th St, Euclid, OH 44132 and is currently estimated at $135,127, approximately $108 per square foot. 1664 E 276th St is a home located in Cuyahoga County with nearby schools including Bluestone Elementary School, Euclid High School, and All Saints of St. John Vianney School.
Ownership History
Date
Name
Owned For
Owner Type
Purchase Details
Closed on
Oct 12, 2021
Sold by
Martin Chavel A
Bought by
Fig and Fig Oh18 Llc
Current Estimated Value
Purchase Details
Closed on
Jun 29, 2020
Sold by
Estate Of Stanley Taylor
Bought by
Taylor Stanley and Taylor Wyunna
Purchase Details
Closed on
Aug 13, 2012
Sold by
M17s Lp
Bought by
Martin Chavel A
Purchase Details
Closed on
Aug 29, 2011
Sold by
Hsbc Bank Usa Na
Bought by
M17s Lp
Purchase Details
Closed on
Jun 17, 2010
Sold by
Mcduffie James and Mcduffie Jean
Bought by
Hsbc Bank Usa Na
Purchase Details
Closed on
Jan 30, 1987
Sold by
Cann Charles A
Bought by
Mcduffie Jas and Mcduffie Jean
Purchase Details
Closed on
Oct 12, 1984
Sold by
Cann C Y and C Y
Bought by
Cann Charles A
Purchase Details
Closed on
Jan 1, 1975
Bought by
Cann C Y and C Y
Create a Home Valuation Report for This Property
The Home Valuation Report is an in-depth analysis detailing your home's value as well as a comparison with similar homes in the area
Home Values in the Area
Average Home Value in this Area
Purchase History
| Date | Buyer | Sale Price | Title Company |
|---|---|---|---|
| Fig | $2,092 | None Listed On Document | |
| Taylor Stanley | -- | None Available | |
| Martin Chavel A | $13,000 | None Available | |
| M17s Lp | $8,000 | None Available | |
| Hsbc Bank Usa Na | $30,000 | Attorney | |
| Mcduffie Jas | $57,000 | -- | |
| Cann Charles A | -- | -- | |
| Cann C Y | -- | -- |
Source: Public Records
Tax History
| Year | Tax Paid | Tax Assessment Tax Assessment Total Assessment is a certain percentage of the fair market value that is determined by local assessors to be the total taxable value of land and additions on the property. | Land | Improvement |
|---|---|---|---|---|
| 2025 | $1,813 | $26,320 | $6,580 | $19,740 |
| 2024 | $1,872 | $26,320 | $6,580 | $19,740 |
| 2023 | $1,771 | $19,850 | $5,360 | $14,490 |
| 2022 | $1,732 | $19,850 | $5,360 | $14,490 |
| 2021 | $1,920 | $19,850 | $5,360 | $14,490 |
| 2020 | $1,623 | $15,050 | $4,060 | $10,990 |
| 2019 | $1,454 | $43,000 | $11,600 | $31,400 |
| 2018 | $975 | $15,050 | $4,060 | $10,990 |
| 2017 | $530 | $3,890 | $3,360 | $530 |
| 2016 | $531 | $3,890 | $3,360 | $530 |
| 2015 | $2,399 | $3,890 | $3,360 | $530 |
| 2014 | $2,399 | $4,560 | $3,960 | $600 |
Source: Public Records
Map
Nearby Homes
- 1670 Hillandale Dr
- 127 Brush Rd
- 145 Richmond Rd
- 28855 Hazel Ave
- 28900 Euclid Ave
- 2715 Cabin Dr
- 1471 Hall Ct
- 1530 E 254th St
- 1437 E 252nd St
- 28755 Chardon Rd
- 1552 E 254th St
- V/L 39 Chardon Rd
- 815 E 272nd St
- 2919 Emerald Lakes Blvd
- 890 E 250th St
- 25161 Euclid Ave
- 795 E 260th St
- 1790 Skyline Dr
- 1807 Skyline Dr
- 24991 Euclid Ave
- 1664 E 276th St Unit E
- 1670 E 276th St
- 1660 E 276th St
- 1674 E 276th St
- 1654 E 276th St
- 1644 E 276th St
- 1680 E 276th St
- 1665 E 276th St
- 1661 E 276th St
- 1671 E 276th St
- 1655 E 276th St
- 1651 E 276th St
- 1675 E 276th St
- V/L 94 V/L Tremaine Dr
- 1641 E 276th St
- 1631 E 276th St
- 1664 Hillandale Dr
- 27600 Tremaine Dr
- 1660 Hillandale Dr
- 1680 Hillandale Dr
Your Personal Tour Guide
Ask me questions while you tour the home.