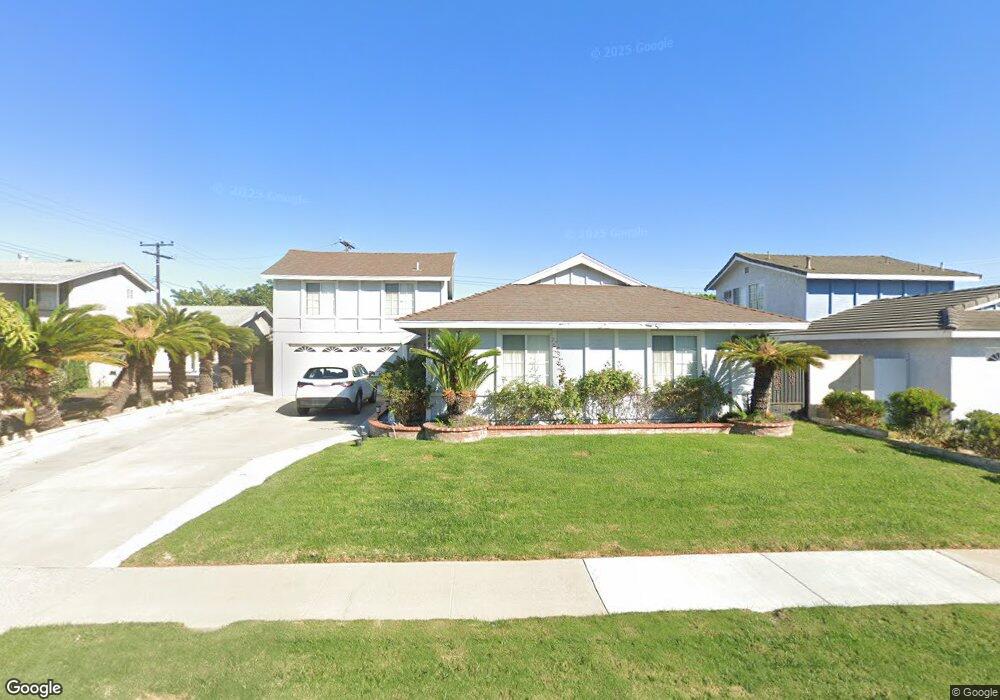
16644 Bushard St Fountain Valley, CA 92708
Estimated Value: $1,208,000 - $1,499,000
3
Beds
3
Baths
2,084
Sq Ft
$668/Sq Ft
Est. Value
About This Home
This home is located at 16644 Bushard St, Fountain Valley, CA 92708 and is currently estimated at $1,392,060, approximately $667 per square foot. 16644 Bushard St is a home located in Orange County with nearby schools including Plavan (Urbain H.) Elementary School, Masuda (Kazuo) Middle School, and Fountain Valley High School.
Ownership History
Date
Name
Owned For
Owner Type
Purchase Details
Closed on
May 27, 2018
Sold by
Vo Manh Duc and Nguyen Christine Nga
Bought by
Vo Manu Duc and Nguyen Christine Nga
Current Estimated Value
Purchase Details
Closed on
Nov 19, 1998
Sold by
Van Nguyen My and Van Nga Christine
Bought by
Vo Manh Duc and Nguyen Christine Nga
Home Financials for this Owner
Home Financials are based on the most recent Mortgage that was taken out on this home.
Original Mortgage
$153,000
Interest Rate
6.84%
Purchase Details
Closed on
Nov 16, 1993
Sold by
Vanvannguyen At Van
Bought by
Vanvannguyen My Van and Vo Manh Duc
Home Financials for this Owner
Home Financials are based on the most recent Mortgage that was taken out on this home.
Original Mortgage
$156,800
Interest Rate
7.09%
Create a Home Valuation Report for This Property
The Home Valuation Report is an in-depth analysis detailing your home's value as well as a comparison with similar homes in the area
Home Values in the Area
Average Home Value in this Area
Purchase History
| Date | Buyer | Sale Price | Title Company |
|---|---|---|---|
| Vo Manu Duc | -- | None Available | |
| Vo Manh Duc | -- | Landwood Title Company | |
| Vanvannguyen My Van | $196,000 | Title Land Company |
Source: Public Records
Mortgage History
| Date | Status | Borrower | Loan Amount |
|---|---|---|---|
| Closed | Vo Manh Duc | $153,000 | |
| Closed | Vanvannguyen My Van | $156,800 |
Source: Public Records
Tax History Compared to Growth
Tax History
| Year | Tax Paid | Tax Assessment Tax Assessment Total Assessment is a certain percentage of the fair market value that is determined by local assessors to be the total taxable value of land and additions on the property. | Land | Improvement |
|---|---|---|---|---|
| 2025 | $4,147 | $362,519 | $241,773 | $120,746 |
| 2024 | $4,147 | $355,411 | $237,032 | $118,379 |
| 2023 | $4,046 | $348,443 | $232,385 | $116,058 |
| 2022 | $3,984 | $341,611 | $227,828 | $113,783 |
| 2021 | $3,907 | $334,913 | $223,361 | $111,552 |
| 2020 | $3,883 | $331,479 | $221,070 | $110,409 |
| 2019 | $3,805 | $324,980 | $216,735 | $108,245 |
| 2018 | $3,732 | $318,608 | $212,485 | $106,123 |
| 2017 | $3,672 | $312,361 | $208,318 | $104,043 |
| 2016 | $3,518 | $306,237 | $204,234 | $102,003 |
| 2015 | $3,463 | $301,638 | $201,167 | $100,471 |
| 2014 | $3,394 | $295,730 | $197,227 | $98,503 |
Source: Public Records
Map
Nearby Homes
- 9446 Gardenia Ave
- 16767 Madrone Cir
- 16806 Olive St
- 16379 Shadbush St
- 9801 Hibiscus Ave
- 17215 Buttonwood St
- 17333 Brookhurst St Unit D6
- 17441 Ash St
- 17210 San Mateo St Unit 25
- 16551 Ross Ln
- 16871 Ross Ln
- 9429 El Valle Ave
- 15781 Clarendon St
- 16582 Lucia Ln
- 15710 Poinsettia Way
- 9190 Poppy Cir
- 10322 Avenida Cinco de Mayo
- 16761 Irby Ln
- 8822 Palos Verdes Ave
- 10452 Circulo de Juarez
- 16654 Bushard St
- 16632 Bushard St
- 16649 Cedar Cir
- 16666 Bushard St
- 16659 Cedar Cir
- 9526 Gardenia Ave
- 9514 Gardenia Ave
- 9538 Gardenia Ave
- 16643 Cedar Cir
- 16671 Cedar Cir
- 16678 Bushard St
- 9550 Gardenia Ave
- 16681 Cedar Cir
- 16648 Olive St
- 16656 Olive St
- 16690 Bushard St
- 9564 Gardenia Ave
- 16642 Cedar Cir
- 9482 Gardenia Ave
- 16666 Olive St