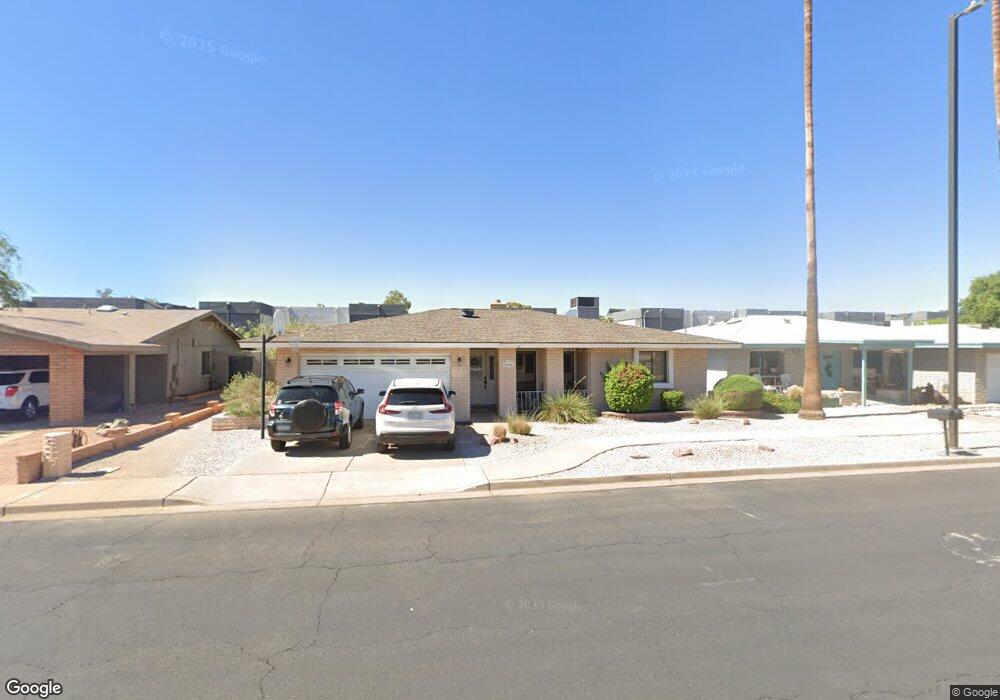
1666 S Cholla Mesa, AZ 85202
Dobson NeighborhoodEstimated Value: $387,947 - $518,000
--
Bed
2
Baths
1,845
Sq Ft
$249/Sq Ft
Est. Value
About This Home
This home is located at 1666 S Cholla, Mesa, AZ 85202 and is currently estimated at $459,737, approximately $249 per square foot. 1666 S Cholla is a home located in Maricopa County with nearby schools including Franklin at Brimhall Elementary School, Washington Elementary School, and Franklin Accelerated Academy Jordan Campus.
Ownership History
Date
Name
Owned For
Owner Type
Purchase Details
Closed on
Jan 13, 2021
Sold by
Fawns Marybeth
Bought by
Marybeth Fawns Living Trust and Fawns
Current Estimated Value
Purchase Details
Closed on
Jan 12, 2021
Sold by
Marybeth Fawns
Bought by
Marybeth Fawns and The Marybeth Fawns Living Trus
Purchase Details
Closed on
Feb 19, 1999
Sold by
Fawns Jess C
Bought by
Fawns Jess C and Fawns Marybeth
Purchase Details
Closed on
Aug 11, 1998
Sold by
Fawns Marybeth
Bought by
Fawns Jess C
Home Financials for this Owner
Home Financials are based on the most recent Mortgage that was taken out on this home.
Original Mortgage
$92,800
Interest Rate
6.88%
Purchase Details
Closed on
Jul 12, 1994
Sold by
Borg Ronald I and Borg Janina J
Bought by
Fawns Jess C and Fawns Marybeth
Home Financials for this Owner
Home Financials are based on the most recent Mortgage that was taken out on this home.
Original Mortgage
$52,654
Interest Rate
8.57%
Mortgage Type
Seller Take Back
Create a Home Valuation Report for This Property
The Home Valuation Report is an in-depth analysis detailing your home's value as well as a comparison with similar homes in the area
Home Values in the Area
Average Home Value in this Area
Purchase History
| Date | Buyer | Sale Price | Title Company |
|---|---|---|---|
| Marybeth Fawns Living Trust | -- | Reynoso Luke | |
| Marybeth Fawns | -- | None Available | |
| Marybeth Fawns | -- | None Available | |
| Fawns Jess C | -- | Old Republic Title Agency | |
| Fawns Jess C | -- | Old Republic Title Agency | |
| Fawns Jess C | $92,900 | Security Title Agency |
Source: Public Records
Mortgage History
| Date | Status | Borrower | Loan Amount |
|---|---|---|---|
| Previous Owner | Fawns Jess C | $92,800 | |
| Previous Owner | Fawns Jess C | $52,654 |
Source: Public Records
Tax History Compared to Growth
Tax History
| Year | Tax Paid | Tax Assessment Tax Assessment Total Assessment is a certain percentage of the fair market value that is determined by local assessors to be the total taxable value of land and additions on the property. | Land | Improvement |
|---|---|---|---|---|
| 2025 | $1,737 | $17,610 | -- | -- |
| 2024 | $1,743 | $16,771 | -- | -- |
| 2023 | $1,743 | $34,000 | $6,800 | $27,200 |
| 2022 | $1,707 | $24,770 | $4,950 | $19,820 |
| 2021 | $1,727 | $23,230 | $4,640 | $18,590 |
| 2020 | $1,705 | $21,880 | $4,370 | $17,510 |
| 2019 | $1,593 | $20,550 | $4,110 | $16,440 |
| 2018 | $1,529 | $19,020 | $3,800 | $15,220 |
| 2017 | $1,483 | $17,770 | $3,550 | $14,220 |
| 2016 | $1,456 | $17,650 | $3,530 | $14,120 |
| 2015 | $1,368 | $16,030 | $3,200 | $12,830 |
Source: Public Records
Map
Nearby Homes
- 1652 S Saguaro
- 2146 W Isabella Ave Unit 121
- 2146 W Isabella Ave Unit 254
- 2146 W Isabella Ave Unit 131
- 1542 W Impala Ave
- 1718 S Longmore Unit 95
- 1718 S Longmore Unit 67
- 1718 S Longmore Unit 50
- 2040 S Longmore Unit 9
- 2040 S Longmore Unit 33
- 2019 S Henkel Cir
- 1920 W Linder Ave Unit 229
- 1920 W Lindner Ave Unit 222
- 1920 W Lindner Ave Unit 269
- 1920 W Lindner Ave Unit 108
- 2331 W Via Rialto Cir
- 2061 S Rogers
- 2208 W Lindner Ave Unit 34
- 2208 W Lindner Ave Unit 1
- 1840 W Southern Ave
- 1706 S Cholla
- 1660 S Cholla
- 1712 S Cholla
- 1652 S Cholla
- 1720 S Cholla
- 1661 S Cholla
- 1646 S Cholla
- 1703 S Cholla
- 1719 S Cholla Unit 3
- 1701 S Cholla
- 1665 S Cholla
- 1726 S Cholla
- 1640 S Cholla Unit 3
- 1651 S Dobson Rd Unit ST
- 1651 S Dobson Rd Unit STD
- 1651 S Dobson Rd Unit 21
- 1651 S Dobson Rd Unit 2.2
- 1651 S Dobson Rd Unit 2
- 1651 S Dobson Rd Unit 1
- 1651 S Dobson Rd