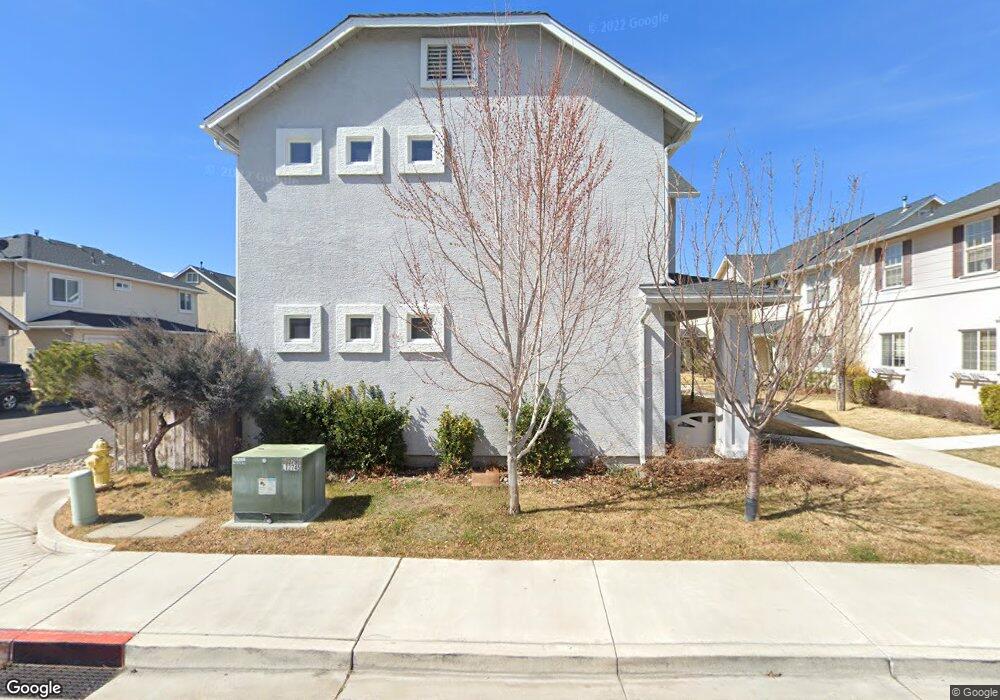
1666 W Minden Village Loop Minden, NV 89423
Estimated Value: $503,000 - $655,000
4
Beds
3
Baths
1,875
Sq Ft
$297/Sq Ft
Est. Value
About This Home
This home is located at 1666 W Minden Village Loop, Minden, NV 89423 and is currently estimated at $556,839, approximately $296 per square foot. 1666 W Minden Village Loop is a home located in Douglas County with nearby schools including Minden Elementary School, Carson Valley Middle School, and Douglas County High School.
Ownership History
Date
Name
Owned For
Owner Type
Purchase Details
Closed on
Dec 12, 2012
Sold by
Hamilton William Shannon
Bought by
Hamilton Nataliya
Current Estimated Value
Purchase Details
Closed on
Oct 8, 2012
Sold by
Hamilton Nataliya
Bought by
Hamilton Nataliya
Purchase Details
Closed on
Feb 4, 2008
Sold by
Stahl Martin and Stahl Nataliya
Bought by
Stahl Nataliya
Home Financials for this Owner
Home Financials are based on the most recent Mortgage that was taken out on this home.
Original Mortgage
$200,000
Outstanding Balance
$121,530
Interest Rate
5.37%
Mortgage Type
New Conventional
Estimated Equity
$435,309
Purchase Details
Closed on
Sep 23, 2005
Sold by
Minden Village 50 Llc
Bought by
Guintoli Nataliya
Home Financials for this Owner
Home Financials are based on the most recent Mortgage that was taken out on this home.
Original Mortgage
$200,000
Interest Rate
5.62%
Mortgage Type
Adjustable Rate Mortgage/ARM
Create a Home Valuation Report for This Property
The Home Valuation Report is an in-depth analysis detailing your home's value as well as a comparison with similar homes in the area
Home Values in the Area
Average Home Value in this Area
Purchase History
| Date | Buyer | Sale Price | Title Company |
|---|---|---|---|
| Hamilton Nataliya | -- | First Americantitle State L | |
| Hamilton Nataliya | -- | First American Title Insuran | |
| Stahl Nataliya | -- | First American Title Reno | |
| Guintoli Nataliya | $345,500 | Marquis Title & Escrow Inc |
Source: Public Records
Mortgage History
| Date | Status | Borrower | Loan Amount |
|---|---|---|---|
| Open | Stahl Nataliya | $200,000 | |
| Closed | Guintoli Nataliya | $200,000 |
Source: Public Records
Tax History Compared to Growth
Tax History
| Year | Tax Paid | Tax Assessment Tax Assessment Total Assessment is a certain percentage of the fair market value that is determined by local assessors to be the total taxable value of land and additions on the property. | Land | Improvement |
|---|---|---|---|---|
| 2025 | $2,517 | $91,779 | $26,250 | $65,529 |
| 2024 | $2,330 | $90,419 | $24,500 | $65,919 |
| 2023 | $2,330 | $86,639 | $24,500 | $62,139 |
| 2022 | $2,158 | $77,549 | $19,250 | $58,299 |
| 2021 | $2,095 | $71,117 | $15,750 | $55,367 |
| 2020 | $2,026 | $70,184 | $15,750 | $54,434 |
| 2019 | $1,967 | $67,508 | $14,000 | $53,508 |
| 2018 | $1,910 | $65,256 | $14,000 | $51,256 |
| 2017 | $1,854 | $65,715 | $14,000 | $51,715 |
| 2016 | $1,807 | $63,947 | $12,250 | $51,697 |
| 2015 | $1,803 | $63,947 | $12,250 | $51,697 |
| 2014 | $1,751 | $51,780 | $10,500 | $41,280 |
Source: Public Records
Map
Nearby Homes
- 1661 W Minden Village Loop
- 1686 W Minden Village Loop
- 1795 U S Highway 395 N
- 1615 Delta Downs Dr Unit Homesite 54
- 1620 Delta Downs Dr Unit 67
- 1630 Delta Downs Dr Unit Homesite 72
- 1608 Delta Downs Dr Unit Homesite 61
- 1606 Delta Downs Dr Unit Homesite 60
- 1631 Delta Downs Dr Unit Homesite 52
- 451 Golden Gate Ct
- Residence 6 Plan at The Village at Monte Vista
- Residence 5 Plan at The Village at Monte Vista
- Residence 4 Plan at The Village at Monte Vista
- Residence 3 Plan at The Village at Monte Vista
- Residence 2 Plan at The Village at Monte Vista
- Residence 1 Plan at The Village at Monte Vista
- 1606 10th St
- Plan 2 at The Downs at Monte Vista
- Plan 1 at The Downs at Monte Vista
- 1721 Lantana Dr
- 1668 W Minden Village Loop
- 1664 W Minden Village Loop
- 1672 W Minden Village Loop
- 1670 W Minden Village Loop
- 1674 W Minden Village Loop
- 1660 W Minden Village Loop
- 1662 W Minden Village Loop
- 1658 W Minden Village Loop
- 1669 W Minden Village Loop
- 1678 W Minden Village Loop
- 1676 W Minden Village Loop
- 1654 W Minden Village Loop
- 1680 W Minden Village Loop
- 1656 W Minden Village Loop
- 1652 W Minden Village Loop
- 1671 W Minden Village Loop
- 1659 W Minden Village Loop
- 1684 W Minden Village Loop
- 1667 Lucerne St
- 1667 Lucerne St Unit D