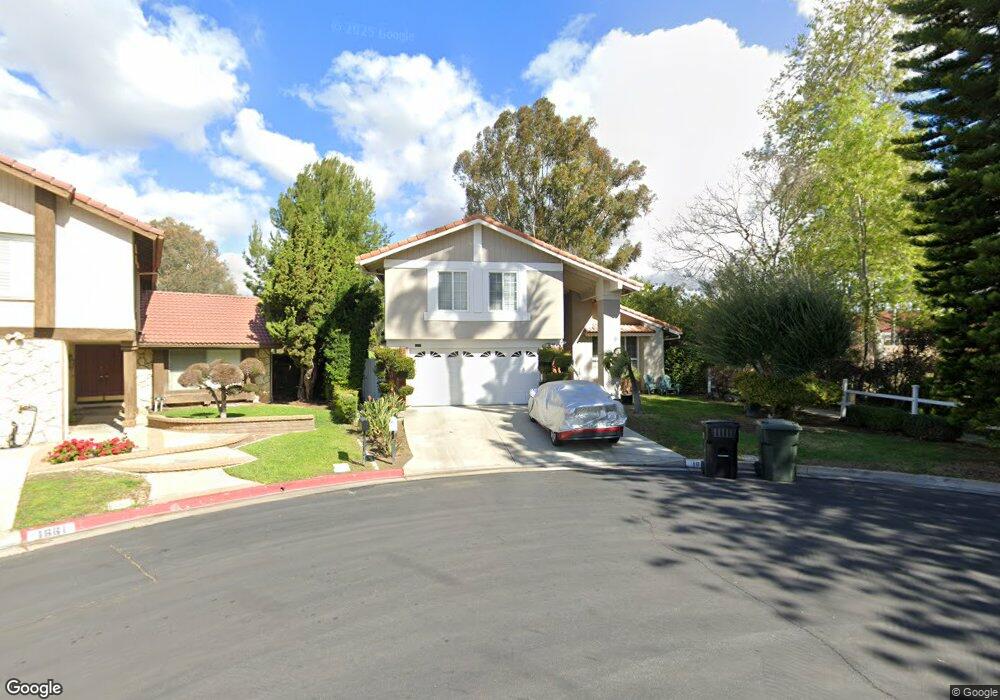
1667 Camden Place Fullerton, CA 92833
Sunny Hills NeighborhoodEstimated Value: $1,126,000 - $1,457,000
4
Beds
3
Baths
2,001
Sq Ft
$650/Sq Ft
Est. Value
About This Home
This home is located at 1667 Camden Place, Fullerton, CA 92833 and is currently estimated at $1,301,035, approximately $650 per square foot. 1667 Camden Place is a home located in Orange County with nearby schools including Fern Drive Elementary School, D. Russell Parks Junior High School, and Sunny Hills High School.
Ownership History
Date
Name
Owned For
Owner Type
Purchase Details
Closed on
Oct 29, 1998
Sold by
Nobar Feredoon
Bought by
Nobar Feredoon and Agah Azam
Current Estimated Value
Home Financials for this Owner
Home Financials are based on the most recent Mortgage that was taken out on this home.
Original Mortgage
$171,000
Outstanding Balance
$37,358
Interest Rate
6.6%
Estimated Equity
$1,263,677
Purchase Details
Closed on
Feb 5, 1997
Sold by
Agah Azam
Bought by
Nobar Feredoon
Home Financials for this Owner
Home Financials are based on the most recent Mortgage that was taken out on this home.
Original Mortgage
$175,000
Interest Rate
7.66%
Purchase Details
Closed on
Jan 6, 1997
Sold by
Eon Choi Jun and Sook Nam Sook
Bought by
Nobar Feredoon
Home Financials for this Owner
Home Financials are based on the most recent Mortgage that was taken out on this home.
Original Mortgage
$175,000
Interest Rate
7.66%
Create a Home Valuation Report for This Property
The Home Valuation Report is an in-depth analysis detailing your home's value as well as a comparison with similar homes in the area
Home Values in the Area
Average Home Value in this Area
Purchase History
| Date | Buyer | Sale Price | Title Company |
|---|---|---|---|
| Nobar Feredoon | -- | Gateway Title Company | |
| Nobar Feredoon | -- | Fidelity National Title Ins | |
| Nobar Feredoon | $248,000 | Fidelity National Title Ins |
Source: Public Records
Mortgage History
| Date | Status | Borrower | Loan Amount |
|---|---|---|---|
| Open | Nobar Feredoon | $171,000 | |
| Closed | Nobar Feredoon | $175,000 |
Source: Public Records
Tax History
| Year | Tax Paid | Tax Assessment Tax Assessment Total Assessment is a certain percentage of the fair market value that is determined by local assessors to be the total taxable value of land and additions on the property. | Land | Improvement |
|---|---|---|---|---|
| 2025 | $4,541 | $403,908 | $215,385 | $188,523 |
| 2024 | $4,541 | $395,989 | $211,162 | $184,827 |
| 2023 | $4,429 | $388,225 | $207,022 | $181,203 |
| 2022 | $4,396 | $380,613 | $202,963 | $177,650 |
| 2021 | $4,319 | $373,150 | $198,983 | $174,167 |
| 2020 | $4,294 | $369,324 | $196,942 | $172,382 |
| 2019 | $4,184 | $362,083 | $193,081 | $169,002 |
| 2018 | $4,120 | $354,984 | $189,295 | $165,689 |
| 2017 | $4,051 | $348,024 | $185,583 | $162,441 |
| 2016 | $3,967 | $341,200 | $181,944 | $159,256 |
| 2015 | $3,856 | $336,075 | $179,211 | $156,864 |
| 2014 | $3,745 | $329,492 | $175,700 | $153,792 |
Source: Public Records
Map
Nearby Homes
- 2720 Gallio Dr
- 1715 Fairford Dr
- 1605 Avenida Selva Unit 217
- 2709 Baycrest Place
- 5471 Jonesboro Way
- 2505 Regency Cir
- 921 Creekside Dr Unit 131
- 2426 Plaza de Vista
- 1216 Mcfadden Dr
- 926 Whitewater Dr Unit 96
- 2523 Cypress Point Dr
- 5105 Fairview Cir
- 904 Whitewater Dr Unit 6
- 804 Creekside Dr Unit 56
- 4900 Lincolnshire Ave
- 8641 Buena Tierra Place
- 0 Rosecrans Ave
- 8365 Kiley Ct
- 2009 W Las Lanas Ln
- 4840 Sunnybrook Ave
- 1661 Camden Place
- 1655 Camden Place
- 1501 Fairgreen Dr
- 1505 Fairgreen Dr
- 1656 Camden Place
- 1649 Camden Place
- 1453 Post Rd
- 1644 Camden Place
- 1511 Fairgreen Dr
- 1643 Camden Place
- 2641 Greenhill Dr
- 1447 Post Rd
- 1636 Camden Place
- 1517 Fairgreen Dr
- 1637 Camden Place
- 2633 Greenhill Dr
- 1439 Post Rd Unit 42AC
- 1502 Fairgreen Dr
- 1628 Camden Place
- 1523 Fairgreen Dr
Your Personal Tour Guide
Ask me questions while you tour the home.