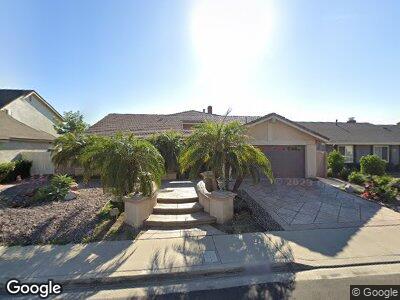
1668 Alderwood Place Thousand Oaks, CA 91362
Estimated Value: $1,004,096 - $1,136,000
4
Beds
2
Baths
1,750
Sq Ft
$614/Sq Ft
Est. Value
About This Home
This home is located at 1668 Alderwood Place, Thousand Oaks, CA 91362 and is currently estimated at $1,074,524, approximately $614 per square foot. 1668 Alderwood Place is a home located in Ventura County with nearby schools including Ladera Stars Academy, Los Cerritos Middle School, and Westlake High School.
Ownership History
Date
Name
Owned For
Owner Type
Purchase Details
Closed on
Mar 12, 2018
Sold by
Shae Thomas and Keene John Richard
Bought by
Shae Thomas
Current Estimated Value
Purchase Details
Closed on
Dec 16, 2010
Sold by
Keene John R and Shae Thomas
Bought by
Shae Thomas and Keene John R
Home Financials for this Owner
Home Financials are based on the most recent Mortgage that was taken out on this home.
Original Mortgage
$358,000
Outstanding Balance
$30,558
Interest Rate
3.72%
Mortgage Type
New Conventional
Estimated Equity
$987,095
Purchase Details
Closed on
Oct 22, 1995
Sold by
Fairbairn Carl E and Fairbairn Beverly M
Bought by
Keene John R and Shae Thomas
Create a Home Valuation Report for This Property
The Home Valuation Report is an in-depth analysis detailing your home's value as well as a comparison with similar homes in the area
Home Values in the Area
Average Home Value in this Area
Purchase History
| Date | Buyer | Sale Price | Title Company |
|---|---|---|---|
| Shae Thomas | -- | None Available | |
| Shae Thomas | -- | Lsi Local Solutions | |
| Keene John R | $14,000 | Investors Title Company |
Source: Public Records
Mortgage History
| Date | Status | Borrower | Loan Amount |
|---|---|---|---|
| Open | Shae Thomas | $358,000 | |
| Closed | Keene John R | $448,000 | |
| Closed | Shae Thomas | $249,999 | |
| Closed | Shae Thomas | $100,000 | |
| Closed | Keene John R | $294,000 | |
| Closed | Shae Thomas | $27,000 |
Source: Public Records
Tax History Compared to Growth
Tax History
| Year | Tax Paid | Tax Assessment Tax Assessment Total Assessment is a certain percentage of the fair market value that is determined by local assessors to be the total taxable value of land and additions on the property. | Land | Improvement |
|---|---|---|---|---|
| 2024 | $5,318 | $463,074 | $166,092 | $296,982 |
| 2023 | $5,152 | $453,995 | $162,836 | $291,159 |
| 2022 | $5,059 | $445,094 | $159,644 | $285,450 |
| 2021 | $4,970 | $436,367 | $156,514 | $279,853 |
| 2020 | $4,551 | $431,895 | $154,910 | $276,985 |
| 2019 | $4,430 | $423,427 | $151,873 | $271,554 |
| 2018 | $4,340 | $415,126 | $148,896 | $266,230 |
| 2017 | $4,255 | $406,987 | $145,977 | $261,010 |
| 2016 | $4,214 | $399,008 | $143,115 | $255,893 |
| 2015 | $4,140 | $393,016 | $140,966 | $252,050 |
| 2014 | $4,080 | $385,318 | $138,205 | $247,113 |
Source: Public Records
Map
Nearby Homes
- 1540 Holly Ct
- 2798 Shelter Wood Ct
- 3220 Versaille Ct
- 1443 Calle Morera
- 1914 Woodside Dr
- 3339 Baccarat St
- 2725 Amber Wood Place
- 3128 Casino Dr
- 3079 Dutch Elm Cir
- 3123 Woodfern Cir
- 1906 Parkwood Ct
- 3160 Boxwood Cir
- 2025 Brookfield Dr
- 2111 Peak Place
- 1681 Calle de Oro
- 3606 Raincloud Ct
- 3563 Quarzo Cir
- 2156 Boe Cir
- 1385 Calle Crisantemo
- 1668 Alderwood Place
- 1662 Alderwood Place
- 1674 Alderwood Place
- 1643 Sweet Briar Place
- 1656 Alderwood Place
- 1680 Alderwood Place
- 1631 Sweet Briar Place
- 1673 Alderwood Place
- 1663 Alderwood Place
- 1655 Sweet Briar Place
- 1688 Alderwood Place
- 1650 Alderwood Place
- 1689 Alderwood Place
- 1653 Alderwood Place
- 1667 Sweet Briar Place
- 1626 Sweet Briar Place
- 1634 Sweet Briar Place
- 1694 Alderwood Place
- 1697 Alderwood Place
- 1644 Alderwood Place