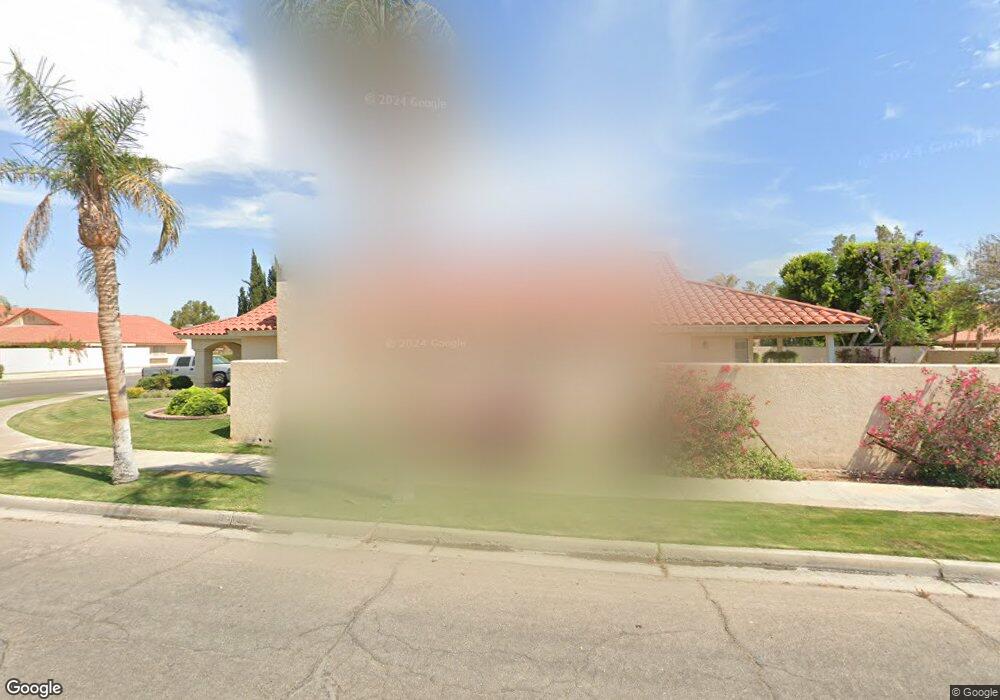
1669 Pepper Ct El Centro, CA 92243
Estimated Value: $555,088 - $665,000
About This Home
This home is located at 1669 Pepper Ct, El Centro, CA 92243 and is currently estimated at $634,522, approximately $275 per square foot. 1669 Pepper Ct is a home located in Imperial County with nearby schools including De Anza Magnet, Wilson Jr. High, and Southwest High School.
Ownership History
We collect this data history from publicly available records. To have your information removed, we recommend requesting removal directly through your county’s website.
Purchase Details
Purchase Details
Home Financials for this Owner
Home Financials are based on the most recent Mortgage that was taken out on this home.Purchase History
We collect this data history from publicly available records. To have your information removed, we recommend requesting removal directly through your county’s website.
| Date | Buyer | Sale Price | Title Company |
|---|---|---|---|
| -- | None Listed On Document | ||
| -- | Chicago Title Co |
Mortgage History
We collect this data history from publicly available records. To have your information removed, we recommend requesting removal directly through your county’s website.
| Date | Status | Borrower | Loan Amount |
|---|---|---|---|
| Previous Owner | $176,500 |
Tax History
We collect this data history from publicly available records. To have your information removed, we recommend requesting removal directly through your county’s website.
| Year | Tax Paid | Tax Assessment Tax Assessment Total Assessment is a certain percentage of the fair market value that is determined by local assessors to be the total taxable value of land and additions on the property. | Land | Improvement |
|---|---|---|---|---|
| 2025 | $3,691 | $341,032 | $53,029 | $288,003 |
| 2023 | $3,691 | $327,791 | $50,971 | $276,820 |
| 2022 | $3,519 | $321,365 | $49,972 | $271,393 |
| 2021 | $3,427 | $315,065 | $48,993 | $266,072 |
| 2020 | $3,492 | $311,835 | $48,491 | $263,344 |
| 2019 | $3,384 | $305,722 | $47,541 | $258,181 |
| 2018 | $3,364 | $299,728 | $46,609 | $253,119 |
| 2017 | $3,328 | $293,852 | $45,696 | $248,156 |
| 2016 | $3,259 | $288,091 | $44,800 | $243,291 |
| 2015 | $3,210 | $283,765 | $44,128 | $239,637 |
| 2014 | $2,652 | $236,000 | $70,000 | $166,000 |
Map
- 1638 S 23rd St
- 1732 S 23rd St
- 2240 Desert Gardens Dr
- 2110 Sandalwood Dr
- 1849 Lotus Ave
- 224 E Aurora Dr
- 931 Kay Davis Ct
- 2361 W Holt Ave
- 1101 Cottonwood Dr
- 1561 W Heil Ave
- 1732 W Brighton Ave Unit D
- 376 Heil St Unit 1
- 1716 W Brighton Ave Unit A
- 1728 W Brighton Ave Unit C
- 1720 W Brighton Ave Unit D
- 1524 W Holt Ave
- 1228 Pepper Dr
- 1012 Sandalwood Dr
- 1186 Whitney Way
- 271 N 23rd St
- 1692 Pepper Ct
- 1668 Pepper Ct
- 2249 0 Pepper Dr
- 1693 S 23rd St
- 2223 Pepper Dr
- 2249 Pepper Dr
- 1703 S 23rd St
- 1669 S 23rd St
- 2257 Pepper Dr
- 1721 S 23rd St
- 2267 Pepper Dr
- 2217 Pepper Dr
- 1647 Pepper Ct
- 2292 Aurora Ct
- 2275 Pepper Dr
- 1739 S 23rd St
- 1625 Pepper Ct
- 2207 Pepper Dr
- 1757 S 23rd St
- 2244 Aurora Ct
Ask me questions while you tour the home.