
Seller's Agent in 2025
Maribel Lopez
Keller Williams Infinity
(630) 888-2113
401 Total Sales
Estimated Value: $450,000 - $462,000
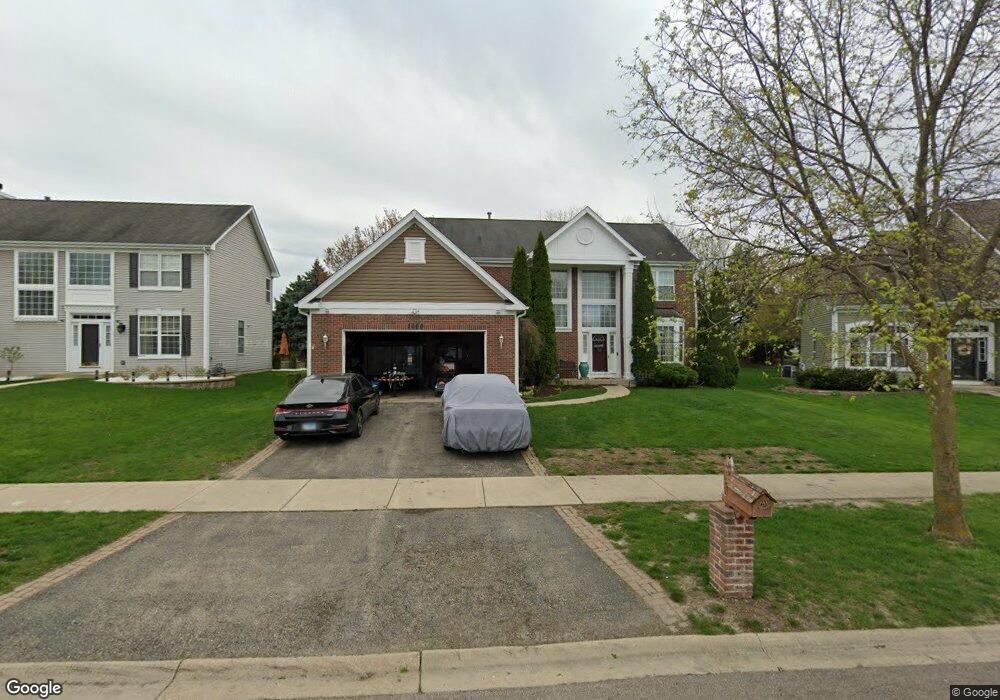
Welcome to your dream home in the highly sought-after Savannah subdivision within the Batavia School District! This stunning property offers the perfect blend of comfort and convenience. Ideally located near the Chicago Premium Outlets, with quick access to I-88, shopping, and a variety of restaurants, you'll have everything you need just minutes away. Step into this spacious and versatile 4-bedroom home featuring a bonus room in the fully finished basement, perfect for a guest room, office, or playroom! Whether you're hosting game nights or just relaxing, the basement is set up for it all with a wet bar, plenty of room to entertain, and cozy vibes throughout. The main level boasts laminate flooring and an open-concept layout, ideal for everyday living and entertaining. This home includes 2 full bathrooms (double vanity) and 2 half baths, offering convenience for everyone in the household. Enjoy the outdoors on the deck in your large backyard. Showings are available now! Contact Co-List Agent Marisol to schedule your private tour today.
| Date | Buyer | Sale Price | Title Company |
|---|---|---|---|
| Gonzalez John P Duran | $250,000 | Greater Metropolitan Title L | |
| Mach John | -- | All American Escrow & Title | |
| Mach John | $228,000 | Chicago Title Insurance Co |
| Date | Status | Borrower | Loan Amount |
|---|---|---|---|
| Previous Owner | Mach John | $296,000 | |
| Previous Owner | Mach John | $193,750 |
| Date | Event | Price | List to Sale | Price per Sq Ft |
|---|---|---|---|---|
| 08/11/2025 08/11/25 | For Sale | $455,000 | -- | $179 / Sq Ft |
| Year | Tax Paid | Tax Assessment Tax Assessment Total Assessment is a certain percentage of the fair market value that is determined by local assessors to be the total taxable value of land and additions on the property. | Land | Improvement |
|---|---|---|---|---|
| 2024 | $11,527 | $141,740 | $19,037 | $122,703 |
| 2023 | $11,400 | $128,644 | $17,278 | $111,366 |
| 2022 | $10,094 | $110,449 | $15,831 | $94,618 |
| 2021 | $8,267 | $89,794 | $15,014 | $74,780 |
| 2020 | $8,120 | $88,067 | $14,725 | $73,342 |
| 2019 | $8,001 | $84,950 | $14,204 | $70,746 |
| 2018 | $7,654 | $81,714 | $13,663 | $68,051 |
| 2017 | $9,412 | $97,580 | $13,212 | $84,368 |
| 2016 | $9,282 | $94,738 | $12,827 | $81,911 |
| 2015 | -- | $92,581 | $12,535 | $80,046 |
| 2014 | -- | $89,666 | $12,140 | $77,526 |
| 2013 | -- | $89,239 | $13,226 | $76,013 |
Seller's Agent in 2025
Maribel Lopez
Keller Williams Infinity
(630) 888-2113
401 Total Sales
Seller Co-Listing Agent in 2025
Marisol Perez
Keller Williams Infinity
(630) 550-7142
54 Total Sales