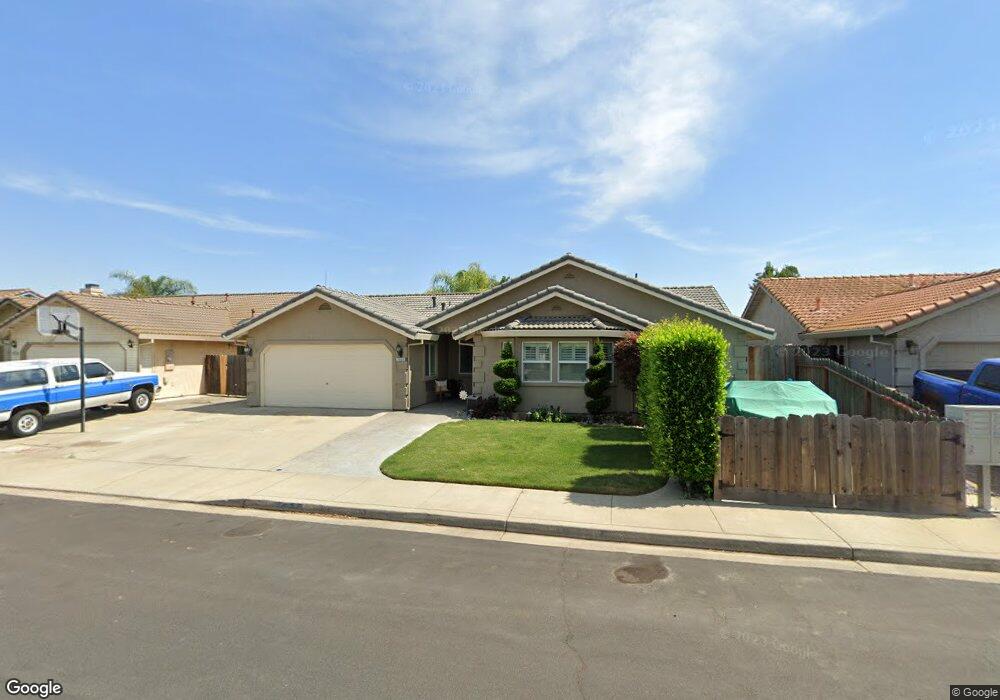
1669 Snowy River St Oakdale, CA 95361
Estimated Value: $442,000 - $527,000
4
Beds
3
Baths
1,837
Sq Ft
$268/Sq Ft
Est. Value
About This Home
This home is located at 1669 Snowy River St, Oakdale, CA 95361 and is currently estimated at $492,895, approximately $268 per square foot. 1669 Snowy River St is a home located in Stanislaus County with nearby schools including Sierra View Elementary School, Oakdale Junior High School, and Oakdale High School.
Ownership History
Date
Name
Owned For
Owner Type
Purchase Details
Closed on
Aug 14, 2003
Sold by
Dugo Timothy Carl and Dugo Lisa A
Bought by
Oliveira Joseph A and Oliveira Janet D
Current Estimated Value
Purchase Details
Closed on
Feb 15, 2000
Sold by
Largent Ellanore Louise and Largent David
Bought by
Carpenter Carl W and Carpenter Christine M
Home Financials for this Owner
Home Financials are based on the most recent Mortgage that was taken out on this home.
Original Mortgage
$75,000
Interest Rate
8.16%
Purchase Details
Closed on
Jan 17, 1996
Sold by
Largent Ellanore Louise and Largent David
Bought by
Largent David E and Largent Ellanore L
Home Financials for this Owner
Home Financials are based on the most recent Mortgage that was taken out on this home.
Original Mortgage
$25,000
Interest Rate
7.14%
Purchase Details
Closed on
Feb 1, 1994
Sold by
Miller Howard William and Miller Linda
Bought by
Largent Ellanore Louise and Largent David
Create a Home Valuation Report for This Property
The Home Valuation Report is an in-depth analysis detailing your home's value as well as a comparison with similar homes in the area
Home Values in the Area
Average Home Value in this Area
Purchase History
| Date | Buyer | Sale Price | Title Company |
|---|---|---|---|
| Oliveira Joseph A | $210,000 | Fidelity National Title | |
| Carpenter Carl W | $132,000 | Fidelity National Title Co | |
| Largent David E | -- | -- | |
| Largent Ellanore Louise | -- | -- |
Source: Public Records
Mortgage History
| Date | Status | Borrower | Loan Amount |
|---|---|---|---|
| Previous Owner | Carpenter Carl W | $75,000 | |
| Previous Owner | Largent David E | $25,000 |
Source: Public Records
Tax History Compared to Growth
Tax History
| Year | Tax Paid | Tax Assessment Tax Assessment Total Assessment is a certain percentage of the fair market value that is determined by local assessors to be the total taxable value of land and additions on the property. | Land | Improvement |
|---|---|---|---|---|
| 2025 | $2,873 | $264,414 | $53,781 | $210,633 |
| 2024 | $2,723 | $259,230 | $52,727 | $206,503 |
| 2023 | $2,664 | $254,148 | $51,694 | $202,454 |
| 2022 | $2,617 | $249,166 | $50,681 | $198,485 |
| 2021 | $2,573 | $244,282 | $49,688 | $194,594 |
| 2020 | $2,543 | $241,778 | $49,179 | $192,599 |
| 2019 | $2,504 | $237,038 | $48,215 | $188,823 |
| 2018 | $2,468 | $232,391 | $47,270 | $185,121 |
| 2017 | $2,423 | $227,836 | $46,344 | $181,492 |
| 2016 | $2,379 | $223,370 | $45,436 | $177,934 |
| 2015 | $1,784 | $168,797 | $44,754 | $124,043 |
| 2014 | $1,766 | $165,492 | $43,878 | $121,614 |
Source: Public Records
Map
Nearby Homes
- 1462 Tumbleweed Ct
- 371 Shalako Dr
- 350 Shalako Dr
- 1485 Jubal Ct
- 1708 Bandon Ct
- 925 Townhill Rd
- 105 Little Johns Creek Dr
- 672 Pedersen Rd
- 109 Little Johns Creek Dr
- 696 Pedersen Rd
- 157 Little Johns Creek Dr
- 129 Little Johns Creek Dr
- 1011 Post Rd
- 410 Arboles Way
- 527 Arbor Ct
- 0 Post Rd Unit 225116478
- 1362 E F St
- 1931 E F St
- 1577 Anconia St
- 228 Reardon St
- 1645 Snowy River St
- 1693 Snowy River St
- 1708 Sterling Hills St
- 1724 Sterling Hills St
- 1717 Snowy River St
- 527 Shawn Vines Ave
- 502 Winterbrook Ave
- 1654 Snowy River St
- 1678 Snowy River St
- 535 Shawn Vines Ave
- 1740 Sterling Hills St
- 1630 Snowy River St
- 543 Shawn Vines Ave
- 1741 Snowy River St
- 1702 Snowy River St
- 1606 Snowy River St
- 551 Shawn Vines Ave
- 1756 Sterling Hills St
- 1721 Sterling Hills St
- 524 Winterbrook Ave