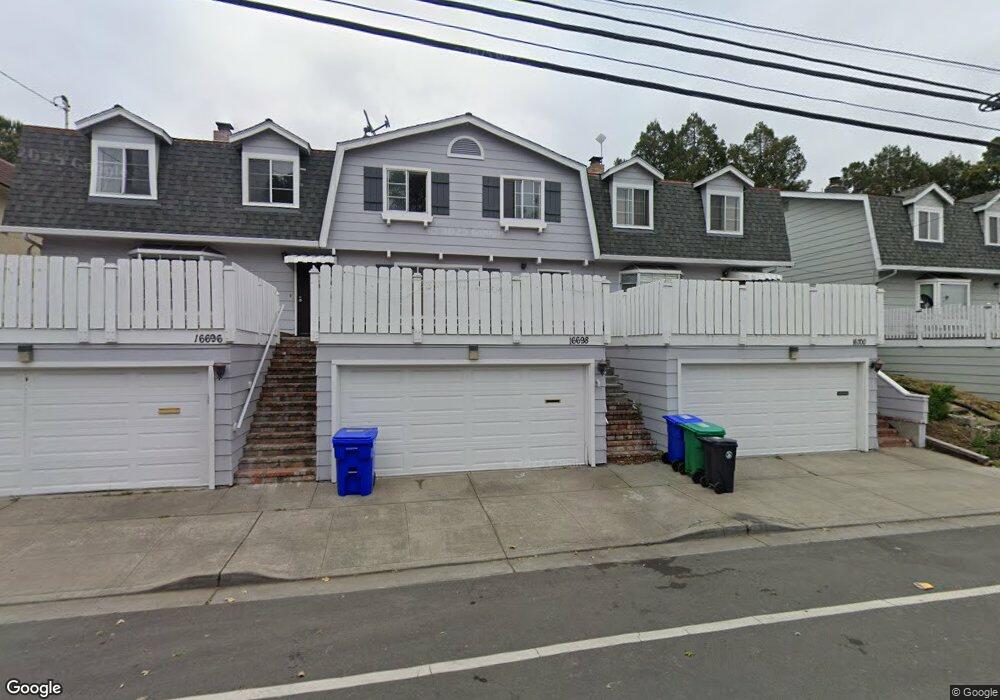
16698 Foothill Blvd Unit 2 San Leandro, CA 94578
West Castro Valley NeighborhoodEstimated Value: $578,000 - $614,000
2
Beds
2
Baths
1,400
Sq Ft
$424/Sq Ft
Est. Value
About This Home
This home is located at 16698 Foothill Blvd Unit 2, San Leandro, CA 94578 and is currently estimated at $593,694, approximately $424 per square foot. 16698 Foothill Blvd Unit 2 is a home located in Alameda County with nearby schools including Corvallis Elementary School, Edendale Middle, and San Lorenzo High School.
Ownership History
Date
Name
Owned For
Owner Type
Purchase Details
Closed on
Jan 13, 2015
Sold by
Bachira Aishaikh Ahmad and Bachira Ahamouri
Bought by
Alshaikh Sobhi
Current Estimated Value
Purchase Details
Closed on
Mar 26, 2010
Sold by
Alshaikh Sobhi
Bought by
Bachira Alshaikh Ahmad and Bachira Ahamnouri
Purchase Details
Closed on
May 4, 2009
Sold by
Bank Of New York
Bought by
Alshaikh Sobhi
Purchase Details
Closed on
Aug 14, 2008
Sold by
Boxdell Kori L
Bought by
Bank Of New York
Purchase Details
Closed on
Aug 6, 1999
Sold by
Campbell John D
Bought by
Boxdell Kori L
Home Financials for this Owner
Home Financials are based on the most recent Mortgage that was taken out on this home.
Original Mortgage
$166,250
Interest Rate
7.7%
Mortgage Type
Purchase Money Mortgage
Create a Home Valuation Report for This Property
The Home Valuation Report is an in-depth analysis detailing your home's value as well as a comparison with similar homes in the area
Home Values in the Area
Average Home Value in this Area
Purchase History
| Date | Buyer | Sale Price | Title Company |
|---|---|---|---|
| Alshaikh Sobhi | -- | Accommodation | |
| Bachira Alshaikh Ahmad | -- | None Available | |
| Alshaikh Sobhi | $126,000 | None Available | |
| Bank Of New York | $251,960 | Landsafe Title | |
| Boxdell Kori L | $175,000 | American Title Co |
Source: Public Records
Mortgage History
| Date | Status | Borrower | Loan Amount |
|---|---|---|---|
| Previous Owner | Boxdell Kori L | $166,250 |
Source: Public Records
Tax History
| Year | Tax Paid | Tax Assessment Tax Assessment Total Assessment is a certain percentage of the fair market value that is determined by local assessors to be the total taxable value of land and additions on the property. | Land | Improvement |
|---|---|---|---|---|
| 2025 | $4,810 | $342,515 | $102,754 | $239,761 |
| 2024 | $4,810 | $335,800 | $100,740 | $235,060 |
| 2023 | $4,796 | $329,217 | $98,765 | $230,452 |
| 2022 | $4,787 | $322,761 | $96,828 | $225,933 |
| 2021 | $4,707 | $316,434 | $94,930 | $221,504 |
| 2020 | $4,482 | $313,191 | $93,957 | $219,234 |
| 2019 | $4,451 | $307,052 | $92,115 | $214,937 |
| 2018 | $4,230 | $301,033 | $90,310 | $210,723 |
| 2017 | $3,935 | $295,131 | $88,539 | $206,592 |
| 2016 | $3,806 | $289,345 | $86,803 | $202,542 |
| 2015 | $3,233 | $241,651 | $72,495 | $169,156 |
| 2014 | $3,325 | $236,920 | $71,076 | $165,844 |
Source: Public Records
Map
Nearby Homes
- 2082 167th Ave
- 16860 Robey Dr
- 16520 Los Banos St
- 17028 Santa fe St
- 1560 165th Ave
- 1510 165th Ave
- 2135 173rd Ave
- 16605 Rolando Ave
- 16330 Ridgehaven Dr Unit 802
- 2392 Austin Ct
- 2500 Miramar Ave Unit 101
- 2500 Miramar Ave Unit 203
- 20111 W Ridge Ct Unit 24
- 16306 Ridgehaven Dr Unit 104
- 16311 Ria Dr
- 0 Lindview Dr
- 1672 162nd Ave
- 19100 Crest Ave Unit 25
- 19100 Crest Ave Unit 100
- 19100 Crest Ave Unit 23
- 16700 Foothill Blvd
- 16696 Foothill Blvd Unit 1
- 16702 Foothill Blvd
- 16704 Foothill Blvd Unit 2
- 16702 Foothill Blvd
- 16706 Foothill Blvd Unit 3
- 16673 Ehle St
- 16669 Ehle St
- 16689 Ehle St
- 16660 Foothill Blvd
- 16657 Ehle St
- 16730 Foothill Blvd
- 16751 Ehle St
- 16643 Ehle St
- 16722 Foothill Blvd
- 16771 Ehle St
- 16635 Ehle St
- 16652 Foothill Blvd
- 16781 Ehle St
- 16625 Ehle St
Your Personal Tour Guide
Ask me questions while you tour the home.