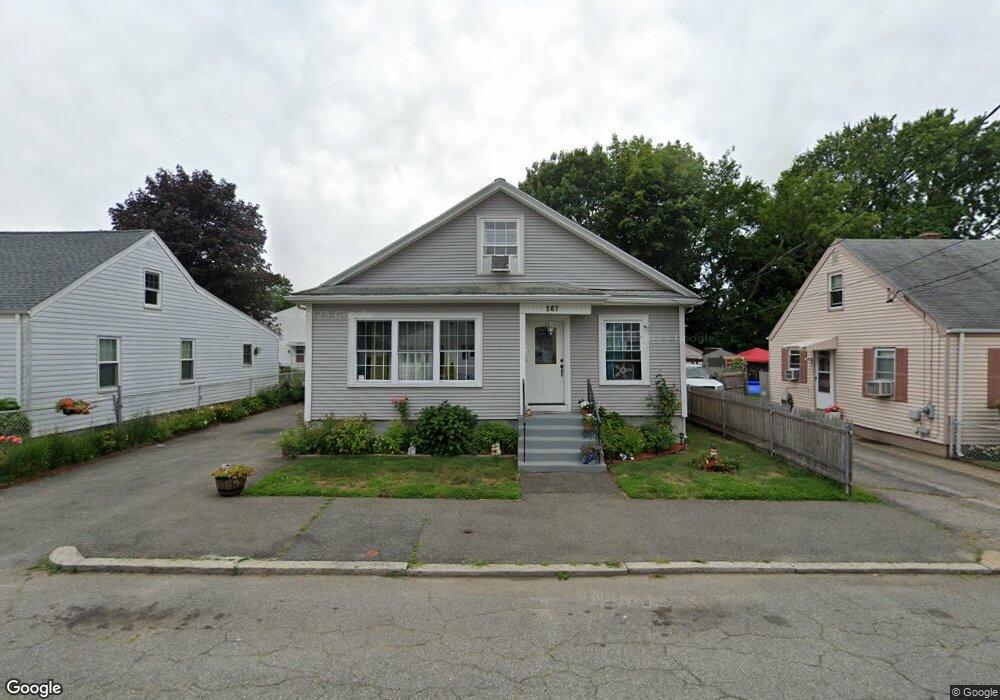
167 Cameron St Pawtucket, RI 02861
Darlington NeighborhoodEstimated Value: $395,285 - $422,000
3
Beds
1
Bath
1,412
Sq Ft
$288/Sq Ft
Est. Value
About This Home
This home is located at 167 Cameron St, Pawtucket, RI 02861 and is currently estimated at $406,321, approximately $287 per square foot. 167 Cameron St is a home located in Providence County with nearby schools including St Cecilia School and Dayspring Christian Academy.
Ownership History
Date
Name
Owned For
Owner Type
Purchase Details
Closed on
Nov 25, 2013
Sold by
Dasilva Paul M and Dasilva Ana P
Bought by
Dasilva Ana P
Current Estimated Value
Purchase Details
Closed on
Nov 24, 1989
Sold by
Labbe Normand M
Bought by
Dasilva Paulo M
Home Financials for this Owner
Home Financials are based on the most recent Mortgage that was taken out on this home.
Original Mortgage
$85,000
Interest Rate
9.83%
Create a Home Valuation Report for This Property
The Home Valuation Report is an in-depth analysis detailing your home's value as well as a comparison with similar homes in the area
Home Values in the Area
Average Home Value in this Area
Purchase History
| Date | Buyer | Sale Price | Title Company |
|---|---|---|---|
| Dasilva Ana P | -- | -- | |
| Dasilva Paulo M | $100,000 | -- |
Source: Public Records
Mortgage History
| Date | Status | Borrower | Loan Amount |
|---|---|---|---|
| Previous Owner | Dasilva Paulo M | $140,000 | |
| Previous Owner | Dasilva Paulo M | $85,000 |
Source: Public Records
Tax History
| Year | Tax Paid | Tax Assessment Tax Assessment Total Assessment is a certain percentage of the fair market value that is determined by local assessors to be the total taxable value of land and additions on the property. | Land | Improvement |
|---|---|---|---|---|
| 2025 | $3,844 | $292,300 | $120,100 | $172,200 |
| 2024 | $3,607 | $292,300 | $120,100 | $172,200 |
| 2023 | $4,116 | $243,000 | $75,100 | $167,900 |
| 2022 | $4,029 | $243,000 | $75,100 | $167,900 |
| 2021 | $4,029 | $243,000 | $75,100 | $167,900 |
| 2020 | $3,443 | $164,800 | $59,300 | $105,500 |
| 2019 | $3,443 | $164,800 | $59,300 | $105,500 |
| 2018 | $3,317 | $164,800 | $59,300 | $105,500 |
| 2017 | $3,226 | $142,000 | $47,800 | $94,200 |
| 2016 | $3,108 | $142,000 | $47,800 | $94,200 |
| 2015 | $3,108 | $142,000 | $47,800 | $94,200 |
| 2014 | $3,415 | $148,100 | $47,800 | $100,300 |
Source: Public Records
Map
Nearby Homes
Your Personal Tour Guide
Ask me questions while you tour the home.