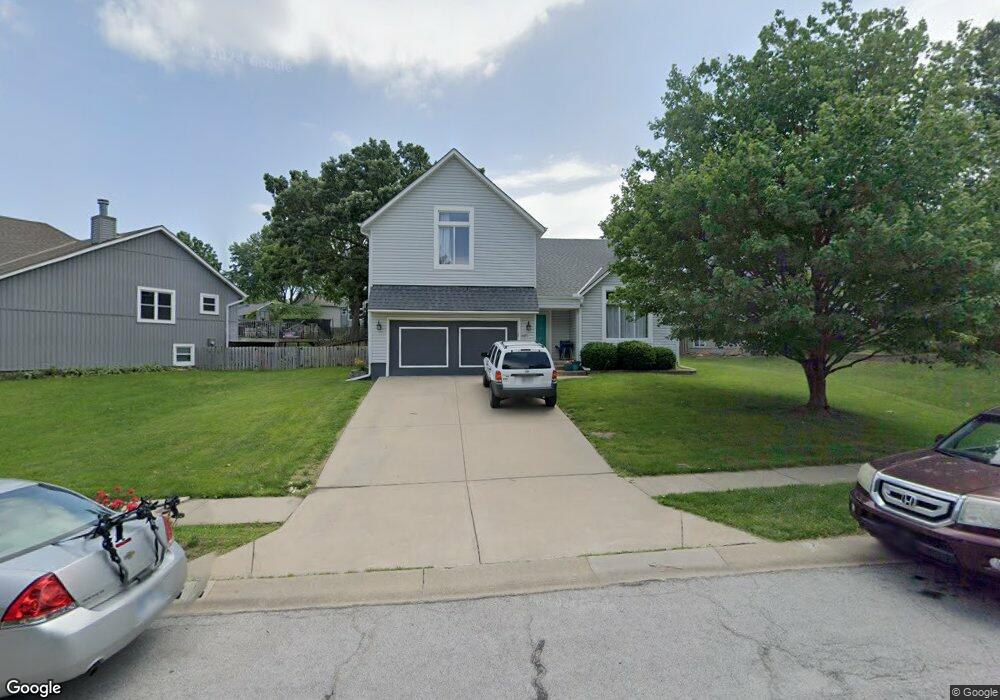
1671 N Hunter Dr Olathe, KS 66061
Estimated Value: $379,000 - $417,000
3
Beds
2
Baths
1,496
Sq Ft
$266/Sq Ft
Est. Value
About This Home
This home is located at 1671 N Hunter Dr, Olathe, KS 66061 and is currently estimated at $398,591, approximately $266 per square foot. 1671 N Hunter Dr is a home located in Johnson County with nearby schools including Mahaffie Elementary School, Santa Fe Trail Middle School, and Olathe North Sr High School.
Ownership History
Date
Name
Owned For
Owner Type
Purchase Details
Closed on
Apr 21, 2017
Sold by
Dodig Dack S
Bought by
Dodig Jami L
Current Estimated Value
Home Financials for this Owner
Home Financials are based on the most recent Mortgage that was taken out on this home.
Original Mortgage
$194,596
Outstanding Balance
$163,320
Interest Rate
4.87%
Mortgage Type
FHA
Estimated Equity
$235,271
Purchase Details
Closed on
Feb 12, 2005
Sold by
Anderson Charles F and Anderson Christina N
Bought by
Dodig Dack S and Dodig Jami L
Home Financials for this Owner
Home Financials are based on the most recent Mortgage that was taken out on this home.
Original Mortgage
$178,000
Interest Rate
5.77%
Mortgage Type
New Conventional
Purchase Details
Closed on
Dec 28, 2000
Sold by
Gerstner Michael J and Gerstner Angela K
Bought by
Anderson Charles F and Anderson Christina N
Home Financials for this Owner
Home Financials are based on the most recent Mortgage that was taken out on this home.
Original Mortgage
$133,200
Interest Rate
8.5%
Create a Home Valuation Report for This Property
The Home Valuation Report is an in-depth analysis detailing your home's value as well as a comparison with similar homes in the area
Home Values in the Area
Average Home Value in this Area
Purchase History
| Date | Buyer | Sale Price | Title Company |
|---|---|---|---|
| Dodig Jami L | -- | Trusted Title & Closing Llc | |
| Dodig Dack S | -- | Kansas Secured Title | |
| Anderson Charles F | -- | Security Land Title Company |
Source: Public Records
Mortgage History
| Date | Status | Borrower | Loan Amount |
|---|---|---|---|
| Open | Dodig Jami L | $194,596 | |
| Closed | Dodig Dack S | $178,000 | |
| Previous Owner | Anderson Charles F | $133,200 |
Source: Public Records
Tax History
| Year | Tax Paid | Tax Assessment Tax Assessment Total Assessment is a certain percentage of the fair market value that is determined by local assessors to be the total taxable value of land and additions on the property. | Land | Improvement |
|---|---|---|---|---|
| 2025 | $4,070 | $40,664 | $7,453 | $33,211 |
| 2024 | $4,070 | $36,432 | $6,779 | $29,653 |
| 2023 | $4,055 | $35,478 | $6,161 | $29,317 |
| 2022 | $3,550 | $30,268 | $5,595 | $24,673 |
| 2021 | $3,857 | $31,223 | $5,595 | $25,628 |
| 2020 | $3,720 | $29,854 | $5,084 | $24,770 |
| 2019 | $3,599 | $28,693 | $4,422 | $24,271 |
| 2018 | $3,324 | $26,335 | $4,422 | $21,913 |
| 2017 | $3,257 | $25,541 | $4,019 | $21,522 |
| 2016 | $2,954 | $23,782 | $4,019 | $19,763 |
| 2015 | $2,844 | $22,920 | $3,656 | $19,264 |
| 2013 | -- | $21,310 | $3,656 | $17,654 |
Source: Public Records
Map
Nearby Homes
- 928 E 120th St
- 952 E 120th St
- 904 E 120th St
- 912 E 120th St
- 976 E 120th St
- 936 E 120th St
- 920 E 120th St
- 944 E 120th St
- 968 E 120th St
- 960 E 120th St
- 1316 E 123rd Unit C Terrace Unit C
- 18995 W 116th St
- 1266 N Prince Edward Island St
- 1305 E 123rd Terrace Unit B
- 19797 W 121st St
- 1019 E New London Dr
- 11531 S Northwood Dr
- 11575 Bill Court Dr Unit 102
- 19527 W 116th St
- 1216 N Parkway Dr
- 1667 N Hunter Dr
- 1681 N Hunter Dr
- 1720 N Sunset Dr
- 1663 N Hunter Dr
- 1691 N Hunter Dr
- 1716 N Sunset Dr
- 1716 N Sunset St
- 1674 N Hunter Dr
- 1684 N Hunter Dr
- 1659 N Hunter Dr
- 1711 N Hunter Dr
- 1664 N Hunter Dr
- 1694 N Hunter Dr
- 1660 N Hunter Dr
- 1704 N Hunter Dr
- 1712 N Sunset Dr
- 1655 N Hunter Dr
- 1714 N Hunter Dr
- 1652 N Hunter Dr
- 1717 N Sunset Dr
Your Personal Tour Guide
Ask me questions while you tour the home.