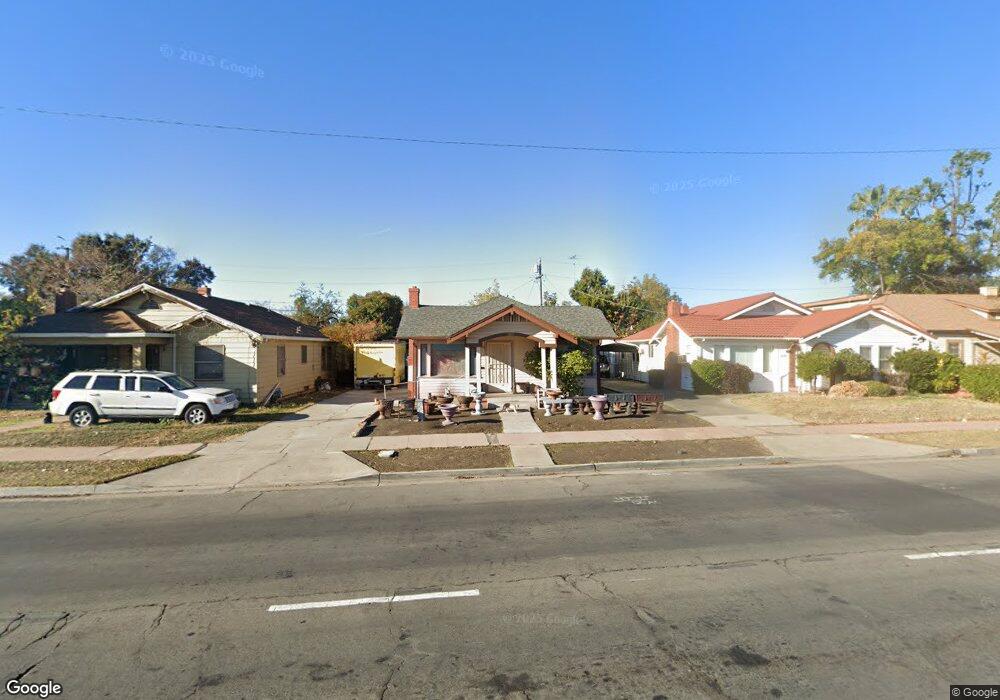
1671 West Ln Stockton, CA 95205
Midtown NeighborhoodEstimated Value: $155,000 - $327,000
2
Beds
1
Bath
1,040
Sq Ft
$249/Sq Ft
Est. Value
About This Home
This home is located at 1671 West Ln, Stockton, CA 95205 and is currently estimated at $258,960, approximately $249 per square foot. 1671 West Ln is a home located in San Joaquin County with nearby schools including Grunsky Elementary School, Harrison Elementary School, and August Elementary School.
Ownership History
Date
Name
Owned For
Owner Type
Purchase Details
Closed on
Aug 28, 2008
Sold by
Wells Fargo Bank National Association
Bought by
Flores Yolanda
Current Estimated Value
Purchase Details
Closed on
May 14, 2008
Sold by
Martinez Arturo Jose and Martinez Norma Elia
Bought by
Wells Fargo Bank Na and Securitized Asset Backed Receivables Llc
Purchase Details
Closed on
Nov 6, 2003
Sold by
Cox John A
Bought by
Martinez Arturo Jose and Martinez Norma Elia
Home Financials for this Owner
Home Financials are based on the most recent Mortgage that was taken out on this home.
Original Mortgage
$124,000
Interest Rate
6.12%
Mortgage Type
Purchase Money Mortgage
Purchase Details
Closed on
May 5, 1994
Sold by
Cox John A
Bought by
Cox John A and Cox Sandra E
Create a Home Valuation Report for This Property
The Home Valuation Report is an in-depth analysis detailing your home's value as well as a comparison with similar homes in the area
Home Values in the Area
Average Home Value in this Area
Purchase History
| Date | Buyer | Sale Price | Title Company |
|---|---|---|---|
| Flores Yolanda | $42,000 | Chicago Title Company | |
| Wells Fargo Bank Na | $111,497 | None Available | |
| Martinez Arturo Jose | $155,000 | Central Valley Title Co | |
| Cox John A | -- | Commonwealth Land Title Ins |
Source: Public Records
Mortgage History
| Date | Status | Borrower | Loan Amount |
|---|---|---|---|
| Previous Owner | Martinez Arturo Jose | $124,000 | |
| Closed | Martinez Arturo Jose | $31,000 |
Source: Public Records
Tax History Compared to Growth
Tax History
| Year | Tax Paid | Tax Assessment Tax Assessment Total Assessment is a certain percentage of the fair market value that is determined by local assessors to be the total taxable value of land and additions on the property. | Land | Improvement |
|---|---|---|---|---|
| 2025 | $1,681 | $54,074 | $28,325 | $25,749 |
| 2024 | $1,641 | $53,015 | $27,770 | $25,245 |
| 2023 | $1,570 | $51,976 | $27,226 | $24,750 |
| 2022 | $1,452 | $50,958 | $26,693 | $24,265 |
| 2021 | $1,394 | $49,960 | $26,170 | $23,790 |
| 2020 | $1,391 | $49,449 | $25,902 | $23,547 |
| 2019 | $1,363 | $48,481 | $25,395 | $23,086 |
| 2018 | $1,318 | $47,532 | $24,898 | $22,634 |
| 2017 | $1,253 | $46,601 | $24,410 | $22,191 |
| 2016 | $1,178 | $45,687 | $23,931 | $21,756 |
| 2014 | $900 | $44,121 | $23,111 | $21,010 |
Source: Public Records
Map
Nearby Homes
- 1372 Bradford St
- 1818 West Ln
- 1272 N Airport Way
- 1711 E Walnut St
- 1155 N Pilgrim St
- 1620 Sycamore Ave
- 1135 N Pilgrim St
- 1751 Sunnyside Ave
- 1702 Sunnyside Ave
- 1600 Sunnyside Ave
- 1257 Sunnyside Ave
- 1902 E Harding Way
- 1037 N Airport Way
- 1813 E Anita St
- 1845 E Poplar St
- 434 E Cleveland St
- 1143 E Park St
- 1123 E Park St
- 644 N Airport Way
- 1404 Williams St
- 1685 West Ln
- 1645 West Ln
- 1695 West Ln
- 1643 West Ln
- 1660 N Berkeley Ave
- 1650 N Berkeley Ave
- 1670 N Berkeley Ave
- 1707 West Ln
- 1641 West Ln
- 1644 N Berkeley Ave
- 1700 N Berkeley Ave
- 1632 N Berkeley Ave
- 1719 West Ln
- 1704 N Berkeley Ave
- 1639 West Ln
- 1716 West Ln
- 1724 West Ln
- 1708 West Ln
- 1630 N Berkeley Ave
- 1740 West Ln