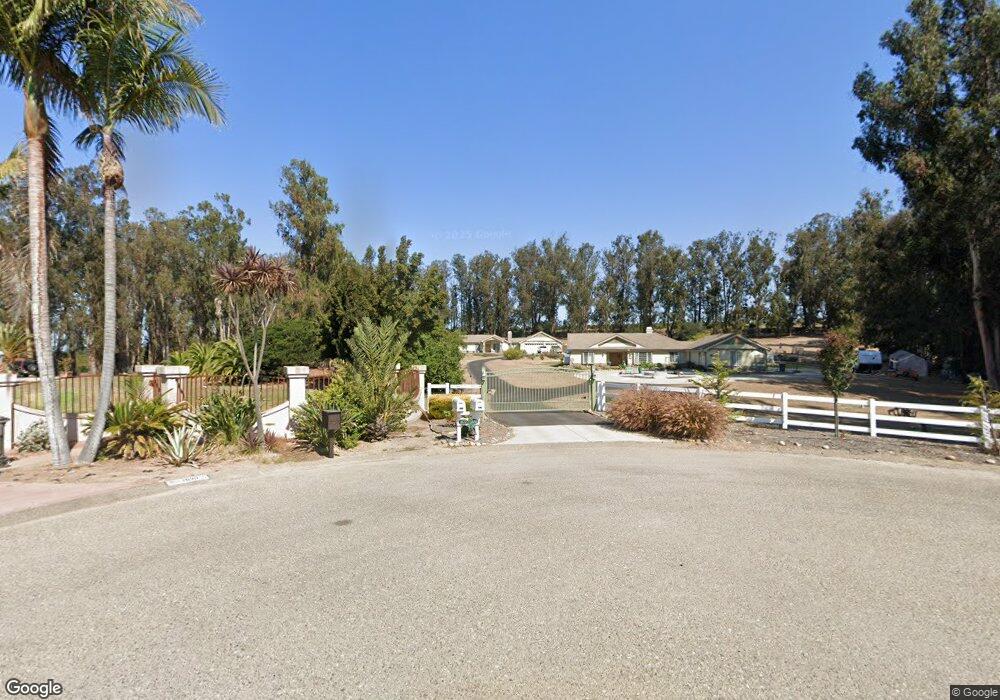
1672 Lacey Ln Nipomo, CA 93444
Estimated Value: $1,322,000 - $2,121,000
6
Beds
5
Baths
4,008
Sq Ft
$403/Sq Ft
Est. Value
About This Home
This home is located at 1672 Lacey Ln, Nipomo, CA 93444 and is currently estimated at $1,615,565, approximately $403 per square foot. 1672 Lacey Ln is a home located in San Luis Obispo County with nearby schools including Dorothea Lange Elementary School, Mesa Middle School, and Nipomo High School.
Ownership History
Date
Name
Owned For
Owner Type
Purchase Details
Closed on
Feb 25, 2016
Sold by
Deeds John and Deeds Denise
Bought by
Espino Glenn A and Espino Claudia A
Current Estimated Value
Home Financials for this Owner
Home Financials are based on the most recent Mortgage that was taken out on this home.
Original Mortgage
$561,200
Interest Rate
3.59%
Mortgage Type
New Conventional
Purchase Details
Closed on
Apr 19, 2013
Sold by
Deeds John A and Celestre Stacey A
Bought by
Deeds John A
Purchase Details
Closed on
Jul 18, 2007
Sold by
Deeds Aurora J and Deeds John
Bought by
Deeds John and Deeds Denise
Home Financials for this Owner
Home Financials are based on the most recent Mortgage that was taken out on this home.
Original Mortgage
$125,000
Interest Rate
6.73%
Mortgage Type
Stand Alone Second
Create a Home Valuation Report for This Property
The Home Valuation Report is an in-depth analysis detailing your home's value as well as a comparison with similar homes in the area
Home Values in the Area
Average Home Value in this Area
Purchase History
| Date | Buyer | Sale Price | Title Company |
|---|---|---|---|
| Espino Glenn A | $950,000 | Fidelity National Title Co | |
| Deeds John A | -- | None Available | |
| Deeds John | -- | Financial Title Company |
Source: Public Records
Mortgage History
| Date | Status | Borrower | Loan Amount |
|---|---|---|---|
| Previous Owner | Espino Glenn A | $561,200 | |
| Previous Owner | Deeds John | $125,000 |
Source: Public Records
Tax History Compared to Growth
Tax History
| Year | Tax Paid | Tax Assessment Tax Assessment Total Assessment is a certain percentage of the fair market value that is determined by local assessors to be the total taxable value of land and additions on the property. | Land | Improvement |
|---|---|---|---|---|
| 2025 | $11,494 | $1,124,600 | $503,109 | $621,491 |
| 2024 | $11,361 | $1,102,550 | $493,245 | $609,305 |
| 2023 | $11,361 | $1,080,932 | $483,574 | $597,358 |
| 2022 | $11,188 | $1,059,739 | $474,093 | $585,646 |
| 2021 | $11,166 | $1,038,961 | $464,798 | $574,163 |
| 2020 | $11,038 | $1,028,309 | $460,033 | $568,276 |
| 2019 | $10,968 | $1,008,147 | $451,013 | $557,134 |
| 2018 | $10,836 | $988,380 | $442,170 | $546,210 |
| 2017 | $10,632 | $969,000 | $433,500 | $535,500 |
| 2016 | $9,729 | $922,050 | $311,887 | $610,163 |
| 2015 | $9,588 | $908,201 | $307,203 | $600,998 |
| 2014 | $8,443 | $815,000 | $210,000 | $605,000 |
Source: Public Records
Map
Nearby Homes
- 808 Albert Way
- 708 Albert Way
- 0 Albert Way
- 540 Byron Ln
- 1790 Calle Laguna
- 1950 Lemon Ranch Rd
- 1473 Willow Rd
- 1337 Black Sage Cir
- 2085 Westhampton Dr
- 462 Camino Perillo
- 1777 Northwood Rd
- 977 Jacqueline Place
- 1270 Coloma Ln
- 1060 Dawn Rd
- 325 Red Oak Way
- 1150 Redberry Place
- 1018 Joseph Ct
- 1783 Trilogy Pkwy
- 1225 Dawn Rd
- 1539 Vista Tesoro Place
- 1670 Lacey Ln
- 1690 Lacey Ln
- 1650 Lacey Ln
- 524 Via Concha Rd
- 1655 Lacey Ln
- 526 Via Concha Rd
- 1685 Lacey Ln
- 1630 Lacey Ln
- 518 Via Concha Rd
- 1625 Lacey Ln
- 511 Woodgreen Way
- 515 Woodgreen Way
- 519 Woodgreen Way
- 523 Woodgreen Way
- 527 Woodgreen Way
- 531 Woodgreen Way
- 535 Woodgreen Way
- 539 Woodgreen Way
- 543 Woodgreen Way
- 547 Woodgreen Way