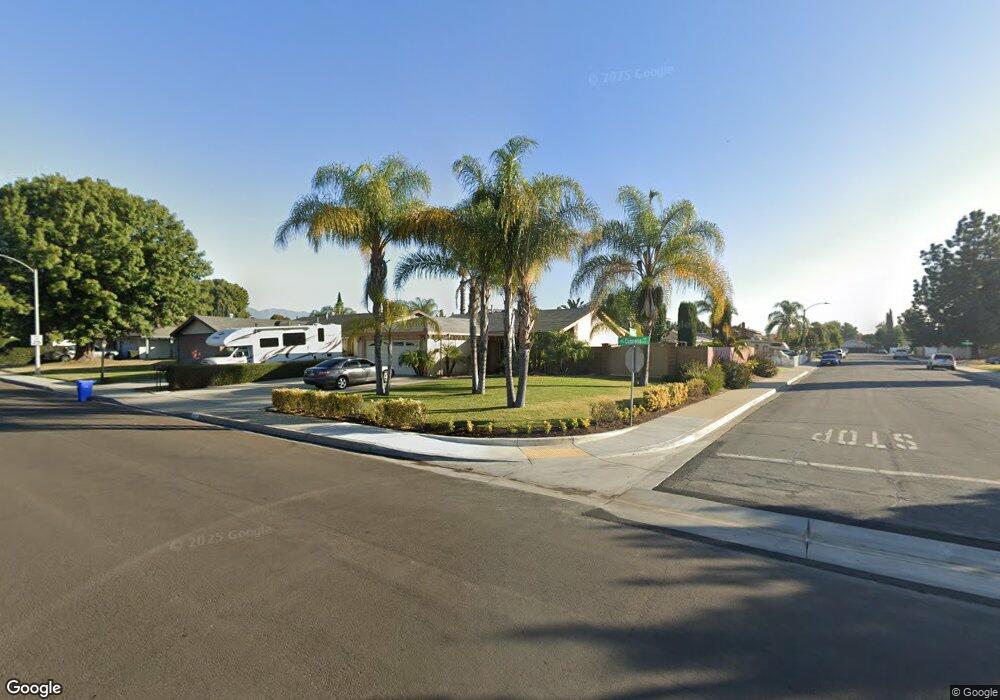
1675 S Cypress Ave Ontario, CA 91762
Downtown Ontario NeighborhoodEstimated Value: $609,149 - $699,000
3
Beds
2
Baths
1,040
Sq Ft
$638/Sq Ft
Est. Value
About This Home
This home is located at 1675 S Cypress Ave, Ontario, CA 91762 and is currently estimated at $664,037, approximately $638 per square foot. 1675 S Cypress Ave is a home located in San Bernardino County with nearby schools including Richard Haynes Elementary, Oaks Middle, and Ontario High School.
Ownership History
Date
Name
Owned For
Owner Type
Purchase Details
Closed on
Jan 26, 2017
Sold by
Luna Lydia H
Bought by
Luna Lydia H and Lydia H Luna Revocable Trust
Current Estimated Value
Purchase Details
Closed on
Jul 11, 2006
Sold by
Luna Lydia H and Martinez Lydia H
Bought by
Luna Lydia H
Purchase Details
Closed on
Oct 24, 2000
Sold by
Martinez Gerardo C and Martinez Lydia H
Bought by
Martinez Lydia H
Purchase Details
Closed on
Dec 17, 1998
Sold by
Venegas Lydia H and Venegas Gerardo C
Bought by
Martinez Gerardo C and Martinez Lydia H
Purchase Details
Closed on
Jun 30, 1998
Sold by
Venegas Lydia H
Bought by
Venegas Lydia H and Martinez Gerardo C
Home Financials for this Owner
Home Financials are based on the most recent Mortgage that was taken out on this home.
Original Mortgage
$86,861
Outstanding Balance
$49,845
Interest Rate
5.67%
Estimated Equity
$614,192
Create a Home Valuation Report for This Property
The Home Valuation Report is an in-depth analysis detailing your home's value as well as a comparison with similar homes in the area
Home Values in the Area
Average Home Value in this Area
Purchase History
| Date | Buyer | Sale Price | Title Company |
|---|---|---|---|
| Luna Lydia H | -- | None Available | |
| Luna Lydia H | -- | Landsafe Title Company | |
| Martinez Lydia H | -- | Orange Coast Title | |
| Martinez Gerardo C | -- | -- | |
| Venegas Lydia H | -- | Northern Counties Title Ins |
Source: Public Records
Mortgage History
| Date | Status | Borrower | Loan Amount |
|---|---|---|---|
| Open | Venegas Lydia H | $86,861 |
Source: Public Records
Tax History Compared to Growth
Tax History
| Year | Tax Paid | Tax Assessment Tax Assessment Total Assessment is a certain percentage of the fair market value that is determined by local assessors to be the total taxable value of land and additions on the property. | Land | Improvement |
|---|---|---|---|---|
| 2025 | $1,539 | $148,790 | $33,312 | $115,478 |
| 2024 | $1,539 | $145,873 | $32,659 | $113,214 |
| 2023 | $1,494 | $143,013 | $32,019 | $110,994 |
| 2022 | $1,473 | $140,209 | $31,391 | $108,818 |
| 2021 | $1,462 | $137,459 | $30,775 | $106,684 |
| 2020 | $1,436 | $136,049 | $30,459 | $105,590 |
| 2019 | $1,422 | $133,382 | $29,862 | $103,520 |
| 2018 | $1,401 | $130,766 | $29,276 | $101,490 |
| 2017 | $1,349 | $128,202 | $28,702 | $99,500 |
| 2016 | $1,295 | $125,688 | $28,139 | $97,549 |
| 2015 | $1,285 | $123,800 | $27,716 | $96,084 |
| 2014 | $1,244 | $121,375 | $27,173 | $94,202 |
Source: Public Records
Map
Nearby Homes
- 1620 S Cypress Ave
- 1546 Redwood Ave
- 1849 S San Antonio Ave
- 2022 S San Antonio Ave
- 1706 S Mountain Ave
- 1726 S Mountain Ave Unit C
- 1712 S Mountain Ave Unit E
- 1604 S Mountain Ave Unit D
- 926 W Philadelphia St Unit 49
- 926 W Philadelphia St Unit R99
- 926 W Philadelphia St Unit 10
- 558 W Philadelphia St
- 1949 S Palm Place
- 4251 S Grasly Paseo
- 1214 S Cypress Ave Unit G
- 1216 S Cypress Ave Unit E
- 653 W Belmont St
- 2064 S Magnolia Ave
- 1209 S Palmetto Ave Unit C
- 754 W Belmont St
- 1669 S Cypress Ave
- 758 W Maple St
- 1705 S Cypress Ave
- 1663 S Cypress Ave
- 752 W Maple St
- 1704 Tiffany Ct
- 1712 S Cypress Ave
- 1720 S Cypress Ave
- 753 Camalot Ct
- 759 Camalot Ct
- 1711 S Cypress Ave
- 1657 S Cypress Ave
- 1726 S Cypress Ave
- 746 W Maple St
- 1666 S Cypress Ave
- 1710 Tiffany Ct
- 1732 S Cypress Ave
- 1717 S Cypress Ave
- 1660 S Cypress Ave
- 747 Camalot Ct