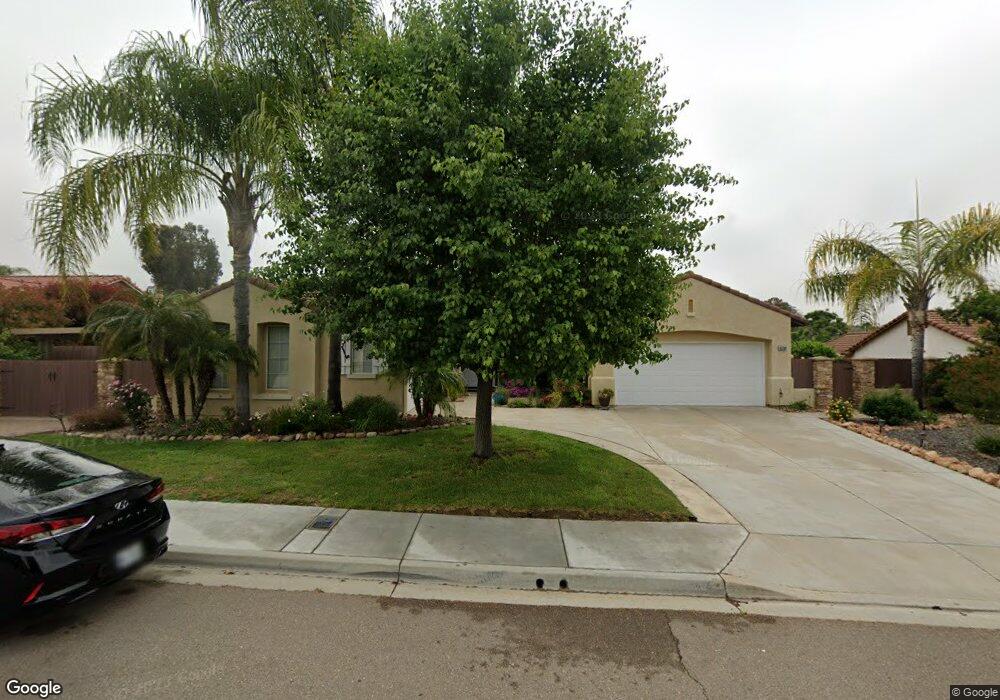
16759 Open View Rd Ramona, CA 92065
San Diego Country Estates NeighborhoodEstimated Value: $763,701 - $919,000
3
Beds
2
Baths
2,004
Sq Ft
$415/Sq Ft
Est. Value
About This Home
This home is located at 16759 Open View Rd, Ramona, CA 92065 and is currently estimated at $831,175, approximately $414 per square foot. 16759 Open View Rd is a home located in San Diego County with nearby schools including Barnett Elementary School, Olive Peirce Middle School, and Ramona High School.
Ownership History
Date
Name
Owned For
Owner Type
Purchase Details
Closed on
Nov 13, 2012
Sold by
Dacquisto Joseph S and Dacquisto Laura E
Bought by
Bertelson Larry D and Bertelson Wrene May
Current Estimated Value
Purchase Details
Closed on
Jul 19, 2002
Sold by
Combs James L and Combs Dana Ann
Bought by
Dacquisto Joseph S and Dacquisto Laura E
Home Financials for this Owner
Home Financials are based on the most recent Mortgage that was taken out on this home.
Original Mortgage
$52,350
Interest Rate
6.52%
Mortgage Type
Purchase Money Mortgage
Purchase Details
Closed on
Jul 16, 1999
Sold by
Ryland Homes Of California Inc
Bought by
Combs James L and Combs Dana Ann
Home Financials for this Owner
Home Financials are based on the most recent Mortgage that was taken out on this home.
Original Mortgage
$191,750
Interest Rate
7.97%
Mortgage Type
Balloon
Create a Home Valuation Report for This Property
The Home Valuation Report is an in-depth analysis detailing your home's value as well as a comparison with similar homes in the area
Home Values in the Area
Average Home Value in this Area
Purchase History
| Date | Buyer | Sale Price | Title Company |
|---|---|---|---|
| Bertelson Larry D | $415,000 | Fidelity National Title | |
| Dacquisto Joseph S | $349,000 | First American Title | |
| Combs James L | $240,000 | -- |
Source: Public Records
Mortgage History
| Date | Status | Borrower | Loan Amount |
|---|---|---|---|
| Previous Owner | Dacquisto Joseph S | $52,350 | |
| Previous Owner | Combs James L | $191,750 |
Source: Public Records
Tax History
| Year | Tax Paid | Tax Assessment Tax Assessment Total Assessment is a certain percentage of the fair market value that is determined by local assessors to be the total taxable value of land and additions on the property. | Land | Improvement |
|---|---|---|---|---|
| 2025 | $3,776 | $273,745 | $90,022 | $183,723 |
| 2024 | $3,776 | $268,378 | $88,257 | $180,121 |
| 2023 | $3,525 | $263,117 | $86,527 | $176,590 |
| 2022 | $3,671 | $257,959 | $84,831 | $173,128 |
| 2021 | $3,626 | $252,902 | $83,168 | $169,734 |
| 2020 | $3,601 | $250,310 | $82,316 | $167,994 |
| 2019 | $3,526 | $245,402 | $80,702 | $164,700 |
| 2018 | $3,443 | $240,591 | $79,120 | $161,471 |
| 2017 | $650 | $235,874 | $77,569 | $158,305 |
| 2016 | $3,304 | $231,250 | $76,049 | $155,201 |
| 2015 | $3,211 | $227,777 | $74,907 | $152,870 |
| 2014 | $3,108 | $223,316 | $73,440 | $149,876 |
Source: Public Records
Map
Nearby Homes
- 23731 Gymkhana Rd
- 23820 Oak Meadow Dr
- 16403 Arena Dr
- 16328 Bassett Ct
- 23540 Oriente Way
- 23502 Bassett Way
- 24131 Del Amo Rd
- 16333 Oak Springs Dr
- 23322 Nuevo Mundo Rd
- 24513 Tesoro Way
- 000 Camino Arriba Unit 3
- 23691 Country Villa Rd
- 23658 Country Villa Rd
- 23823 Green Haven Ln
- 24534 Rutherford Rd
- 15615 Vista Vicente Dr Unit 18
- 24586 Rutherford Rd
- 18351 Woods Hill Ln
- 24726 Zanja Place
- 15647 Calistoga Dr
- 16751 Open View Rd
- 16807 Open View Rd
- 16743 Open View Rd
- 16815 Open View Rd
- 23817 Humiston Way
- 16760 Open View Rd
- 16754 Open View Rd
- 23574 Encina Corte
- 16742 Open View Rd
- 16823 Open View Rd
- 16735 Open View Rd
- 23809 Glenn Ellen Ct
- 23823 Humiston Way
- 23803 Glenn Ellen Ct
- 23822 Humiston Way
- 16730 Open View Rd
- 23569 Encina Corte
- 16828 Open View Rd
- 16727 Open View Rd
- 23609 Galeria Cir
Your Personal Tour Guide
Ask me questions while you tour the home.