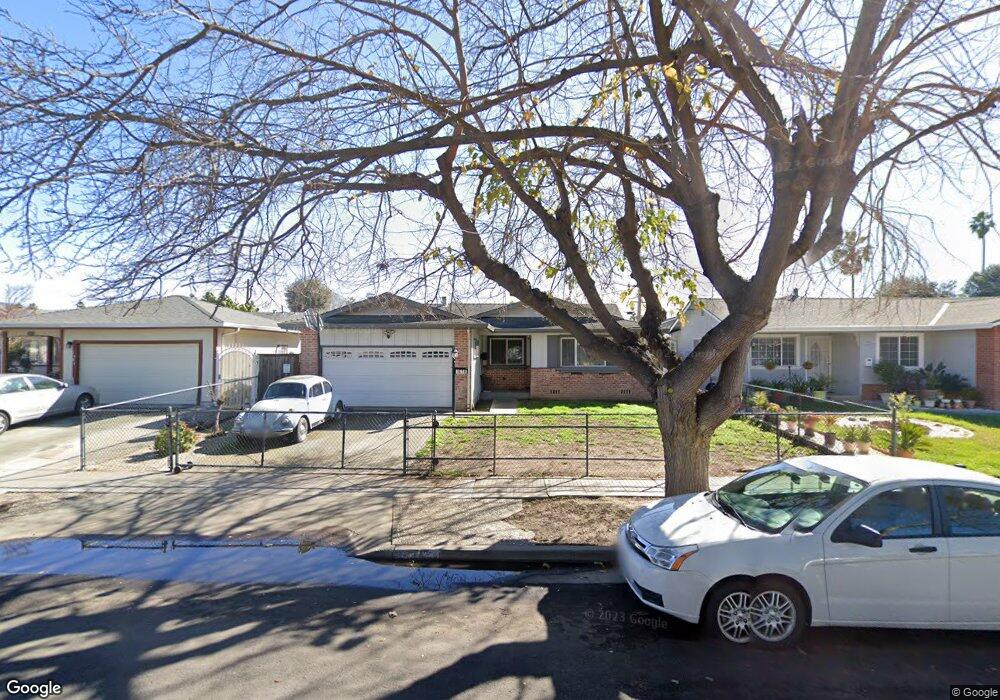
1678 Enesco Ave San Jose, CA 95121
Leyva NeighborhoodEstimated Value: $831,000 - $1,220,000
3
Beds
2
Baths
1,204
Sq Ft
$858/Sq Ft
Est. Value
About This Home
This home is located at 1678 Enesco Ave, San Jose, CA 95121 and is currently estimated at $1,032,870, approximately $857 per square foot. 1678 Enesco Ave is a home located in Santa Clara County with nearby schools including O.B. Whaley Elementary School, George V. Leyva Intermediate School, and Yerba Buena High School.
Ownership History
Date
Name
Owned For
Owner Type
Purchase Details
Closed on
May 5, 2009
Sold by
Mendoza Johnny T and Rubio Terry
Bought by
Rubio Terry and Mendoza Johnny T
Current Estimated Value
Home Financials for this Owner
Home Financials are based on the most recent Mortgage that was taken out on this home.
Original Mortgage
$216,000
Outstanding Balance
$135,442
Interest Rate
4.71%
Mortgage Type
New Conventional
Estimated Equity
$897,428
Purchase Details
Closed on
Aug 17, 2004
Sold by
Mendoza Johnny T
Bought by
Mendoza Johnny T and Rubio Terry
Purchase Details
Closed on
Jul 19, 2001
Sold by
Rubio Terry
Bought by
Mendoza Johnny T
Home Financials for this Owner
Home Financials are based on the most recent Mortgage that was taken out on this home.
Original Mortgage
$200,000
Interest Rate
7.15%
Purchase Details
Closed on
Oct 18, 2000
Sold by
Mendoza Johnny T and Mendoza Robert
Bought by
Mendoza Johnny T
Create a Home Valuation Report for This Property
The Home Valuation Report is an in-depth analysis detailing your home's value as well as a comparison with similar homes in the area
Home Values in the Area
Average Home Value in this Area
Purchase History
| Date | Buyer | Sale Price | Title Company |
|---|---|---|---|
| Rubio Terry | -- | Cornerstone Title Company | |
| Mendoza Johnny T | -- | -- | |
| Mendoza Johnny T | -- | Financial Title Company | |
| Mendoza Johnny T | -- | -- |
Source: Public Records
Mortgage History
| Date | Status | Borrower | Loan Amount |
|---|---|---|---|
| Open | Rubio Terry | $216,000 | |
| Closed | Mendoza Johnny T | $200,000 |
Source: Public Records
Tax History Compared to Growth
Tax History
| Year | Tax Paid | Tax Assessment Tax Assessment Total Assessment is a certain percentage of the fair market value that is determined by local assessors to be the total taxable value of land and additions on the property. | Land | Improvement |
|---|---|---|---|---|
| 2025 | $2,956 | $60,465 | $19,603 | $40,862 |
| 2024 | $2,956 | $59,280 | $19,219 | $40,061 |
| 2023 | $2,843 | $58,119 | $18,843 | $39,276 |
| 2022 | $2,794 | $56,980 | $18,474 | $38,506 |
| 2021 | $2,647 | $55,863 | $18,112 | $37,751 |
| 2020 | $2,457 | $55,291 | $17,927 | $37,364 |
| 2019 | $2,345 | $54,208 | $17,576 | $36,632 |
| 2018 | $2,258 | $53,146 | $17,232 | $35,914 |
| 2017 | $2,208 | $52,105 | $16,895 | $35,210 |
| 2016 | $2,110 | $51,084 | $16,564 | $34,520 |
| 2015 | $2,077 | $50,318 | $16,316 | $34,002 |
| 2014 | $1,262 | $49,333 | $15,997 | $33,336 |
Source: Public Records
Map
Nearby Homes
- 2647 Aida Ave
- 2154 Pastoral Loop
- 3016 Shadow Springs Place Unit 113
- 3241 Shadow Park Place
- 3326 Shadow Park Place
- 2574 Whispering Hills Cir Unit 2574
- 2629 Whispering Hills Dr
- 2566 Boren Dr
- 3354 Shadow Park Place Unit 319
- 1868 Bagpipe Way
- 1520 E Capitol Expy Unit 29
- 1520 E Capitol Expy
- 3262 Firth Way
- 1842 Quimby Rd Unit 1842
- 1058 Tekman Dr Unit 58
- 3463 Sugarcreek Ct
- 1051 Keldon Dr
- 2040 Lanai Ave
- 1381 Taper Ct
- 3211 Pentland Ct
- 1684 Enesco Ave
- 1674 Enesco Ave
- 1675 Saralynn Dr
- 1668 Enesco Ave
- 1681 Saralynn Dr
- 1671 Saralynn Dr
- 1685 Saralynn Dr
- 1665 Saralynn Dr
- 1664 Enesco Ave
- 1694 Enesco Ave
- 1679 Enesco Ave
- 1675 Enesco Ave
- 1685 Enesco Ave
- 1691 Saralynn Dr
- 1669 Enesco Ave
- 1661 Saralynn Dr
- 1689 Enesco Ave
- 1658 Enesco Ave
- 1698 Enesco Ave
- 1665 Enesco Ave