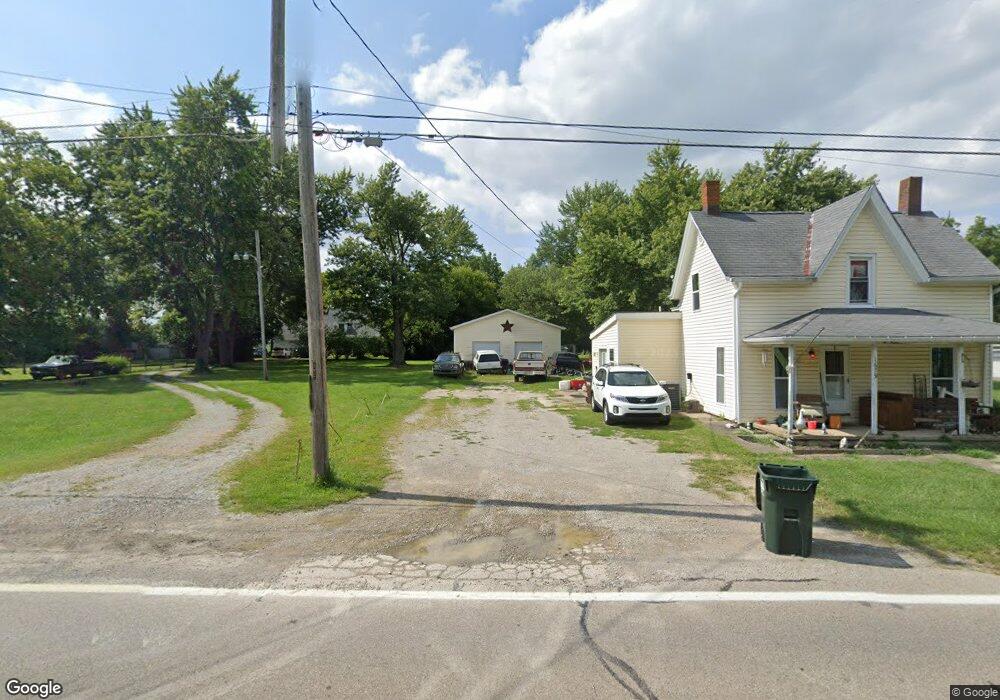
1679 N Us Route 42 Lebanon, OH 45036
Turtlecreek Township NeighborhoodEstimated Value: $189,000 - $332,000
3
Beds
1
Bath
1,224
Sq Ft
$220/Sq Ft
Est. Value
About This Home
This home is located at 1679 N Us Route 42, Lebanon, OH 45036 and is currently estimated at $268,901, approximately $219 per square foot. 1679 N Us Route 42 is a home located in Warren County with nearby schools including Bowman Primary School, Berry Intermediate School, and Donovan Elementary School.
Ownership History
Date
Name
Owned For
Owner Type
Purchase Details
Closed on
Sep 28, 2018
Sold by
Gifford Phillip C and Gifford Amy J
Bought by
Michael Robert G and Richardson Karla R
Current Estimated Value
Home Financials for this Owner
Home Financials are based on the most recent Mortgage that was taken out on this home.
Original Mortgage
$161,515
Outstanding Balance
$140,851
Interest Rate
4.5%
Mortgage Type
Future Advance Clause Open End Mortgage
Estimated Equity
$128,050
Purchase Details
Closed on
Aug 10, 2001
Sold by
Stegemoller Florence
Bought by
Gifford Phillip C and Gifford Amy J
Home Financials for this Owner
Home Financials are based on the most recent Mortgage that was taken out on this home.
Original Mortgage
$71,000
Interest Rate
10.08%
Mortgage Type
New Conventional
Purchase Details
Closed on
May 15, 1978
Sold by
Stegemoller Stegemoller and Stegemoller Edward H
Create a Home Valuation Report for This Property
The Home Valuation Report is an in-depth analysis detailing your home's value as well as a comparison with similar homes in the area
Home Values in the Area
Average Home Value in this Area
Purchase History
| Date | Buyer | Sale Price | Title Company |
|---|---|---|---|
| Michael Robert G | $159,900 | None Available | |
| Gifford Phillip C | $71,000 | -- | |
| -- | -- | -- |
Source: Public Records
Mortgage History
| Date | Status | Borrower | Loan Amount |
|---|---|---|---|
| Open | Michael Robert G | $161,515 | |
| Previous Owner | Gifford Phillip C | $71,000 |
Source: Public Records
Tax History Compared to Growth
Tax History
| Year | Tax Paid | Tax Assessment Tax Assessment Total Assessment is a certain percentage of the fair market value that is determined by local assessors to be the total taxable value of land and additions on the property. | Land | Improvement |
|---|---|---|---|---|
| 2024 | $2,362 | $59,340 | $23,210 | $36,130 |
| 2023 | $1,982 | $44,940 | $12,988 | $31,951 |
| 2022 | $1,955 | $44,940 | $12,989 | $31,952 |
| 2021 | $1,815 | $44,940 | $12,989 | $31,952 |
| 2020 | $1,772 | $36,537 | $10,560 | $25,977 |
| 2019 | $1,782 | $36,537 | $10,560 | $25,977 |
| 2018 | $1,603 | $36,537 | $10,560 | $25,977 |
| 2017 | $1,641 | $33,446 | $9,769 | $23,678 |
| 2016 | $1,696 | $33,446 | $9,769 | $23,678 |
| 2015 | $1,710 | $33,446 | $9,769 | $23,678 |
| 2014 | $1,599 | $29,870 | $8,730 | $21,140 |
| 2013 | $1,591 | $36,130 | $10,550 | $25,580 |
Source: Public Records
Map
Nearby Homes
- 1679 N Us Route 42
- 1691 N Us Route 42
- 1679 N U S 42
- 1696 Route 42 N
- 1696 N Us Route 42
- 1696 U S 42 W
- 1655 N Us Route 42
- 1655 U S 42
- 1652 N Us Route 42
- 1652 N Us Route 42
- 1669 N Us Route 42
- 1711 Route 42 N
- 1711 N Us Route 42
- 1711 N Us Route 42
- 1636 N Us Route 42
- 1732 N Us Route 42
- 1737 N Us Route 42
- 1620 N Us Route 42
- 1618 N Us Route 42
- 1745 N Us Route 42