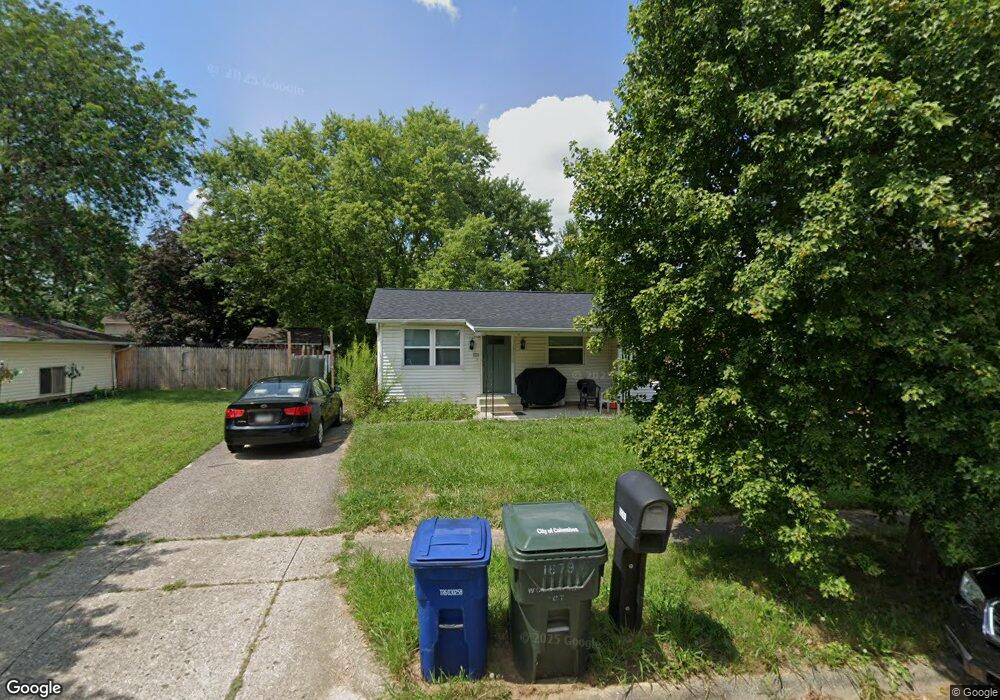
1679 Woodhurst Ct Columbus, OH 43223
Riverbend NeighborhoodEstimated Value: $206,000 - $235,089
3
Beds
1
Bath
1,138
Sq Ft
$199/Sq Ft
Est. Value
About This Home
This home is located at 1679 Woodhurst Ct, Columbus, OH 43223 and is currently estimated at $226,272, approximately $198 per square foot. 1679 Woodhurst Ct is a home located in Franklin County with nearby schools including James A Harmon Elementary School, Franklin Woods Intermediate School, and Finland Middle School.
Ownership History
Date
Name
Owned For
Owner Type
Purchase Details
Closed on
May 3, 2021
Sold by
Marberg Property Solutions Llc
Bought by
Sprow Erik R and Forte Aaren E
Current Estimated Value
Home Financials for this Owner
Home Financials are based on the most recent Mortgage that was taken out on this home.
Original Mortgage
$180,420
Outstanding Balance
$163,506
Interest Rate
3.1%
Mortgage Type
Credit Line Revolving
Estimated Equity
$62,766
Purchase Details
Closed on
Jan 6, 2021
Sold by
Swart James A and Swart Kathy
Bought by
Marberg Property Solutions Llc
Home Financials for this Owner
Home Financials are based on the most recent Mortgage that was taken out on this home.
Original Mortgage
$94,900
Interest Rate
2.71%
Mortgage Type
Commercial
Purchase Details
Closed on
Apr 5, 2011
Sold by
Tudor Jeremy
Bought by
Swart James A and Swart Kathy
Purchase Details
Closed on
Aug 30, 2010
Sold by
Estate Of Betty L Harrison
Bought by
Tudor Jeremy
Purchase Details
Closed on
Jan 3, 1972
Bought by
Harrison Betty L
Create a Home Valuation Report for This Property
The Home Valuation Report is an in-depth analysis detailing your home's value as well as a comparison with similar homes in the area
Home Values in the Area
Average Home Value in this Area
Purchase History
| Date | Buyer | Sale Price | Title Company |
|---|---|---|---|
| Sprow Erik R | $189,000 | Title One | |
| Marberg Property Solutions Llc | $75,000 | Valmer Land Title Agency | |
| Swart James A | $50,000 | Real Living | |
| Tudor Jeremy | -- | None Available | |
| Harrison Betty L | $20,200 | -- |
Source: Public Records
Mortgage History
| Date | Status | Borrower | Loan Amount |
|---|---|---|---|
| Open | Sprow Erik R | $180,420 | |
| Previous Owner | Marberg Property Solutions Llc | $94,900 |
Source: Public Records
Tax History Compared to Growth
Tax History
| Year | Tax Paid | Tax Assessment Tax Assessment Total Assessment is a certain percentage of the fair market value that is determined by local assessors to be the total taxable value of land and additions on the property. | Land | Improvement |
|---|---|---|---|---|
| 2024 | $1,916 | $52,540 | $16,730 | $35,810 |
| 2023 | $1,882 | $52,535 | $16,730 | $35,805 |
| 2022 | $1,519 | $31,120 | $8,750 | $22,370 |
| 2021 | $1,589 | $31,120 | $8,750 | $22,370 |
| 2020 | $1,957 | $31,120 | $8,750 | $22,370 |
| 2019 | $1,492 | $25,900 | $7,280 | $18,620 |
| 2018 | $1,408 | $25,900 | $7,280 | $18,620 |
| 2017 | $1,436 | $25,900 | $7,280 | $18,620 |
| 2016 | $1,391 | $21,390 | $4,520 | $16,870 |
| 2015 | $1,331 | $21,390 | $4,520 | $16,870 |
| 2014 | $1,332 | $21,390 | $4,520 | $16,870 |
| 2013 | $734 | $23,765 | $5,005 | $18,760 |
Source: Public Records
Map
Nearby Homes
- 3326 Bluhm Ct
- 2800 Alkire Rd
- 1657 Ripplebrook Rd
- 1520 Fall Brook Rd
- 2930 Alkire Rd
- 1465 Tall Meadows Dr
- 3206 Andy Terrace
- 3488 Rocky Rd
- 2987 Daisy Ln
- 0 Glencreek Rd
- 2894 Creith Ct
- 1248 Gresham Rd
- 2856 Chesfield Dr
- 3623 High Creek Dr
- 1181 Onslow Dr
- 1226 Pinnacle Dr
- 1830 Winding Hollow Dr
- 2195 Big Run Ave
- 2929 Briggs Rd
- 1485 Demorest Rd
- 1671 Woodhurst Ct
- 1687 Woodhurst Ct
- 3248 Winding Creek Dr
- 1663 Woodhurst Ct
- 1680 Greenville Rd
- 1694 Greenville Rd
- 1672 Greenville Rd
- 1655 Woodhurst Ct
- 1672 Woodhurst Ct
- 1680 Woodhurst Ct
- 1664 Woodhurst Ct
- 1666 Greenville Rd
- 3220 Winding Creek Dr
- 1649 Woodhurst Ct
- 1656 Woodhurst Ct
- 3271 Riverpoint Ct
- 3275 Riverpoint Ct
- 3267 Riverpoint Ct
- 3208 Winding Creek Dr Unit 210
- 3208-3210 Winding Creek Dr