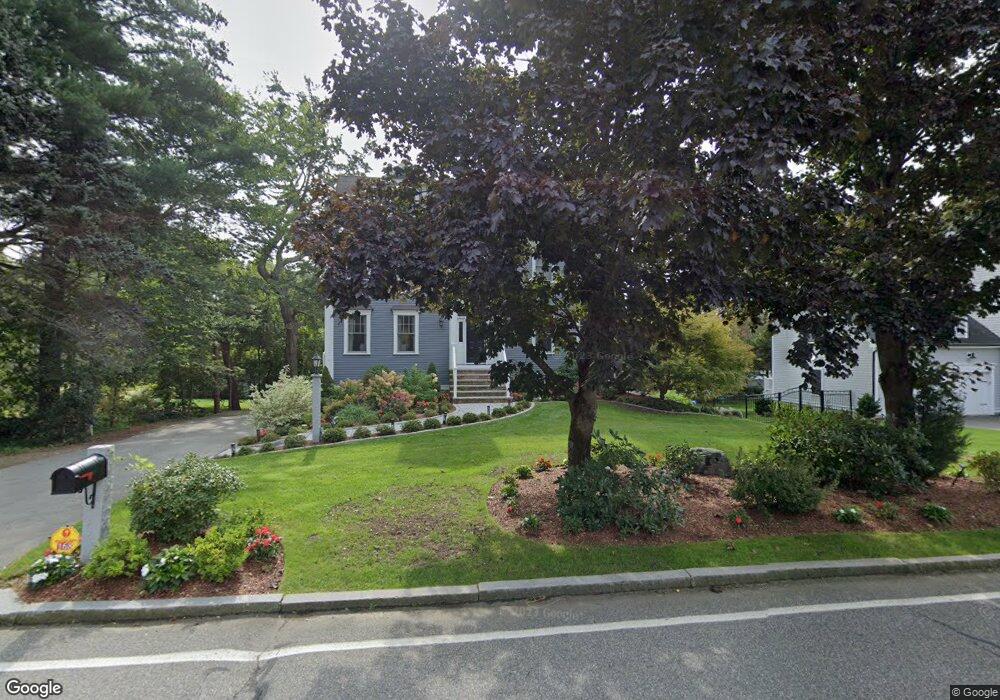
168 High St Winchester, MA 01890
West Side NeighborhoodEstimated Value: $2,006,264 - $2,473,000
4
Beds
4
Baths
3,600
Sq Ft
$617/Sq Ft
Est. Value
About This Home
This home is located at 168 High St, Winchester, MA 01890 and is currently estimated at $2,220,816, approximately $616 per square foot. 168 High St is a home located in Middlesex County with nearby schools including Vinson-Owen Elementary School, McCall Middle School, and Winchester High School.
Ownership History
Date
Name
Owned For
Owner Type
Purchase Details
Closed on
Sep 27, 2007
Sold by
168 High Street Rt
Bought by
Mcanena Laura S and Mcanena Stephen J
Current Estimated Value
Home Financials for this Owner
Home Financials are based on the most recent Mortgage that was taken out on this home.
Original Mortgage
$1,000,000
Interest Rate
6.65%
Mortgage Type
Purchase Money Mortgage
Purchase Details
Closed on
Mar 17, 2006
Sold by
Aharonian John M and Aharonian Karen D
Bought by
168 High Street Rt
Home Financials for this Owner
Home Financials are based on the most recent Mortgage that was taken out on this home.
Original Mortgage
$1,050,000
Interest Rate
6.27%
Mortgage Type
Purchase Money Mortgage
Purchase Details
Closed on
Dec 27, 1996
Sold by
Latzanakis Stephen and Latzanakis Sandra L
Bought by
Aharonian John M and Aharonian Karen D
Purchase Details
Closed on
Jul 31, 1989
Sold by
Wolbrom Norman
Bought by
Latzanakis Stephen
Create a Home Valuation Report for This Property
The Home Valuation Report is an in-depth analysis detailing your home's value as well as a comparison with similar homes in the area
Home Values in the Area
Average Home Value in this Area
Purchase History
| Date | Buyer | Sale Price | Title Company |
|---|---|---|---|
| Mcanena Laura S | $1,350,000 | -- | |
| 168 High Street Rt | $560,000 | -- | |
| Aharonian John M | $310,000 | -- | |
| Latzanakis Stephen | $277,500 | -- |
Source: Public Records
Mortgage History
| Date | Status | Borrower | Loan Amount |
|---|---|---|---|
| Open | Latzanakis Stephen | $959,000 | |
| Closed | Latzanakis Stephen | $140,000 | |
| Closed | Mcanena Laura S | $1,000,000 | |
| Previous Owner | 168 High Street Rt | $1,050,000 |
Source: Public Records
Tax History Compared to Growth
Tax History
| Year | Tax Paid | Tax Assessment Tax Assessment Total Assessment is a certain percentage of the fair market value that is determined by local assessors to be the total taxable value of land and additions on the property. | Land | Improvement |
|---|---|---|---|---|
| 2025 | $223 | $2,013,400 | $810,300 | $1,203,100 |
| 2024 | $22,249 | $1,963,700 | $810,300 | $1,153,400 |
| 2023 | $19,953 | $1,690,900 | $699,800 | $991,100 |
| 2022 | $19,827 | $1,584,900 | $626,100 | $958,800 |
| 2021 | $5,669 | $1,474,400 | $515,600 | $958,800 |
| 2020 | $18,268 | $1,474,400 | $515,600 | $958,800 |
| 2019 | $17,253 | $1,424,700 | $465,900 | $958,800 |
| 2018 | $16,703 | $1,370,200 | $457,600 | $912,600 |
| 2017 | $16,611 | $1,352,700 | $457,600 | $895,100 |
| 2016 | $15,189 | $1,300,400 | $435,500 | $864,900 |
| 2015 | $15,062 | $1,240,700 | $395,900 | $844,800 |
| 2014 | $15,987 | $1,262,800 | $395,900 | $866,900 |
Source: Public Records
Map
Nearby Homes