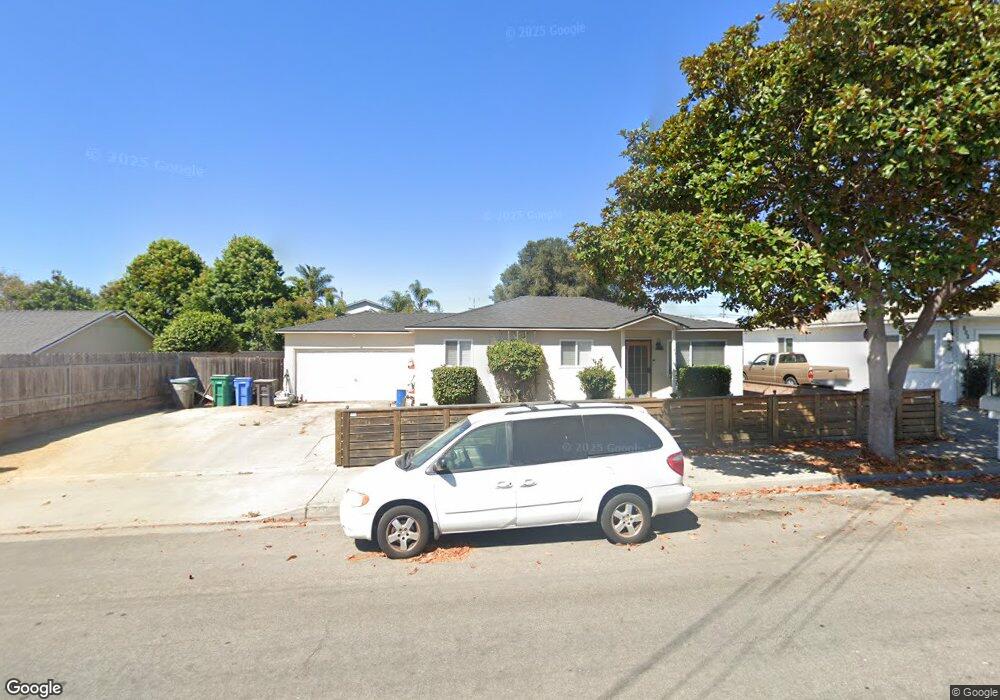
168 S Elm St Arroyo Grande, CA 93420
Estimated Value: $807,000 - $843,000
3
Beds
2
Baths
1,522
Sq Ft
$541/Sq Ft
Est. Value
About This Home
This home is located at 168 S Elm St, Arroyo Grande, CA 93420 and is currently estimated at $823,601, approximately $541 per square foot. 168 S Elm St is a home located in San Luis Obispo County with nearby schools including Harloe Elementary School, Paulding Middle School, and Arroyo Grande High School.
Ownership History
Date
Name
Owned For
Owner Type
Purchase Details
Closed on
Feb 11, 2008
Sold by
Hsbc Bank Usa Na
Bought by
Miller Charlton Cevin
Current Estimated Value
Home Financials for this Owner
Home Financials are based on the most recent Mortgage that was taken out on this home.
Original Mortgage
$242,250
Outstanding Balance
$154,317
Interest Rate
6.25%
Mortgage Type
Purchase Money Mortgage
Estimated Equity
$669,284
Purchase Details
Closed on
Sep 12, 2007
Sold by
Tynon Joseph and Tynon Samantha
Bought by
Hsbc Bank Usa Na
Purchase Details
Closed on
Sep 13, 2006
Sold by
Woodhouse Kelly L
Bought by
Tynon Joseph and Tynon Samantha
Home Financials for this Owner
Home Financials are based on the most recent Mortgage that was taken out on this home.
Original Mortgage
$88,580
Interest Rate
6.46%
Mortgage Type
Stand Alone Second
Create a Home Valuation Report for This Property
The Home Valuation Report is an in-depth analysis detailing your home's value as well as a comparison with similar homes in the area
Home Values in the Area
Average Home Value in this Area
Purchase History
| Date | Buyer | Sale Price | Title Company |
|---|---|---|---|
| Miller Charlton Cevin | $323,000 | Lsi Title Company | |
| Miller Charlton Cevin | -- | Lsi Title Company | |
| Hsbc Bank Usa Na | $379,437 | None Available | |
| Tynon Joseph | $443,000 | Chicago Title Co |
Source: Public Records
Mortgage History
| Date | Status | Borrower | Loan Amount |
|---|---|---|---|
| Open | Miller Charlton Cevin | $242,250 | |
| Previous Owner | Tynon Joseph | $88,580 | |
| Previous Owner | Tynon Joseph | $354,320 |
Source: Public Records
Tax History Compared to Growth
Tax History
| Year | Tax Paid | Tax Assessment Tax Assessment Total Assessment is a certain percentage of the fair market value that is determined by local assessors to be the total taxable value of land and additions on the property. | Land | Improvement |
|---|---|---|---|---|
| 2025 | $4,389 | $424,247 | $269,262 | $154,985 |
| 2024 | $4,338 | $415,930 | $263,983 | $151,947 |
| 2023 | $4,338 | $407,775 | $258,807 | $148,968 |
| 2022 | $4,273 | $399,781 | $253,733 | $146,048 |
| 2021 | $4,264 | $391,943 | $248,758 | $143,185 |
| 2020 | $4,216 | $387,925 | $246,208 | $141,717 |
| 2019 | $4,185 | $380,320 | $241,381 | $138,939 |
| 2018 | $4,135 | $372,864 | $236,649 | $136,215 |
| 2017 | $4,067 | $365,554 | $232,009 | $133,545 |
| 2016 | $3,842 | $358,387 | $227,460 | $130,927 |
| 2015 | $3,810 | $353,005 | $224,044 | $128,961 |
| 2014 | $3,672 | $346,091 | $219,656 | $126,435 |
Source: Public Records
Map
Nearby Homes
- 1401 Cedar St
- 182 Fair View Dr
- 280 Chelsea Ct
- 334 Corona Del Terra
- 450 Pecan St
- 425 Bakeman Ln
- 1162 Brittany Ave
- 1707 Seabright Ave
- 364 S Halcyon Rd
- 366 S Halcyon Rd
- 1950 Newport Ave
- 358 S Halcyon Rd
- 362 S Halcyon Rd
- 1241 Farroll Ave Unit 58
- 575 Carmella Dr
- 1172 Pacific Pointe Way
- 277 Hillcrest Dr Unit 13
- 1747 Brighton Ave
- 282 Robles Rd Unit 19
- 1773 Newport Ave