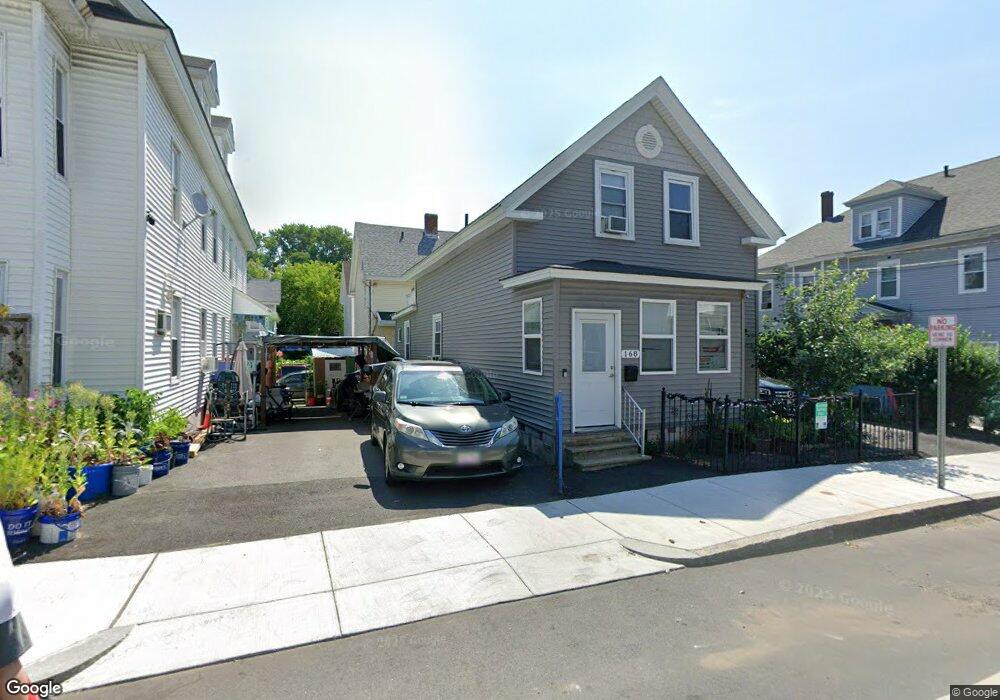
168 Smith St Lowell, MA 01851
Lower Highlands NeighborhoodEstimated Value: $434,000 - $474,000
3
Beds
2
Baths
1,661
Sq Ft
$270/Sq Ft
Est. Value
About This Home
This home is located at 168 Smith St, Lowell, MA 01851 and is currently estimated at $449,281, approximately $270 per square foot. 168 Smith St is a home located in Middlesex County with nearby schools including Abraham Lincoln Elementary School, Charles W. Morey Elementary School, and Dr. Gertrude Bailey Elementary School.
Ownership History
Date
Name
Owned For
Owner Type
Purchase Details
Closed on
Sep 5, 2017
Sold by
S & C Tell Llc
Bought by
So Sophia
Current Estimated Value
Home Financials for this Owner
Home Financials are based on the most recent Mortgage that was taken out on this home.
Original Mortgage
$260,200
Outstanding Balance
$217,110
Interest Rate
3.87%
Mortgage Type
FHA
Estimated Equity
$232,171
Purchase Details
Closed on
Dec 16, 2016
Sold by
Santiago Sandra E and Citizens Bank Na
Bought by
S & C Tell Llc
Create a Home Valuation Report for This Property
The Home Valuation Report is an in-depth analysis detailing your home's value as well as a comparison with similar homes in the area
Home Values in the Area
Average Home Value in this Area
Purchase History
| Date | Buyer | Sale Price | Title Company |
|---|---|---|---|
| So Sophia | $265,000 | -- | |
| S & C Tell Llc | $102,000 | -- | |
| S & C Tell Llc | $102,000 | -- |
Source: Public Records
Mortgage History
| Date | Status | Borrower | Loan Amount |
|---|---|---|---|
| Open | So Sophia | $260,200 | |
| Closed | S & C Tell Llc | $260,200 | |
| Previous Owner | S & C Tell Llc | $75,000 |
Source: Public Records
Tax History
| Year | Tax Paid | Tax Assessment Tax Assessment Total Assessment is a certain percentage of the fair market value that is determined by local assessors to be the total taxable value of land and additions on the property. | Land | Improvement |
|---|---|---|---|---|
| 2025 | $4,342 | $378,200 | $100,000 | $278,200 |
| 2024 | $4,224 | $354,700 | $93,400 | $261,300 |
| 2023 | $3,997 | $321,800 | $81,200 | $240,600 |
| 2022 | $3,594 | $283,200 | $64,200 | $219,000 |
| 2021 | $3,361 | $249,700 | $55,800 | $193,900 |
| 2020 | $3,208 | $240,100 | $55,800 | $184,300 |
| 2019 | $2,974 | $211,800 | $53,100 | $158,700 |
| 2018 | $2,910 | $202,200 | $50,600 | $151,600 |
| 2017 | $2,641 | $177,000 | $49,000 | $128,000 |
| 2016 | $2,468 | $162,800 | $45,500 | $117,300 |
| 2015 | $2,387 | $154,200 | $45,500 | $108,700 |
| 2013 | $2,270 | $151,200 | $54,600 | $96,600 |
Source: Public Records
Map
Nearby Homes
- 15 Barclay St
- 30 Grace St
- 68 Smith St
- 710 School St
- 18 Burgess St
- 143 Westford St
- 42 Branch St
- 3 Butman Place
- 45 Marshall St
- 11 Warwick St Unit 3
- 84 Cambridge St
- 85 B St
- 186 Powell St
- 137 Pine St Unit 11
- 64 Bradstreet Ave
- 312 Wilder St
- 201 Thorndike St Unit 501
- 201 Thorndike St Unit 2-312
- 201 Thorndike St Unit 505
- 525 Chelmsford St
- 8 Brickett Ave
- 164 Smith St
- 9 Brickett Ave
- 10 Brickett Ave
- 176 Smith St
- 158 Smith St
- 11 Brickett Ave
- 171 Smith St
- 160 Smith St
- 175 Smith St
- 165 Smith St
- 163 Smith St Unit 1
- 81 Liberty St
- 81 Liberty St Unit 1
- 81 Liberty St Unit 2
- 18 Barclay St
- 18 Barclay St Unit 2
- 16 Barclay St
- 161 Smith St
- 12 Barclay St
Your Personal Tour Guide
Ask me questions while you tour the home.