16805 Briar St Omaha, NE 68136
Southwest Omaha NeighborhoodEstimated Value: $402,386 - $481,000
3
Beds
4
Baths
2,238
Sq Ft
$198/Sq Ft
Est. Value
About This Home
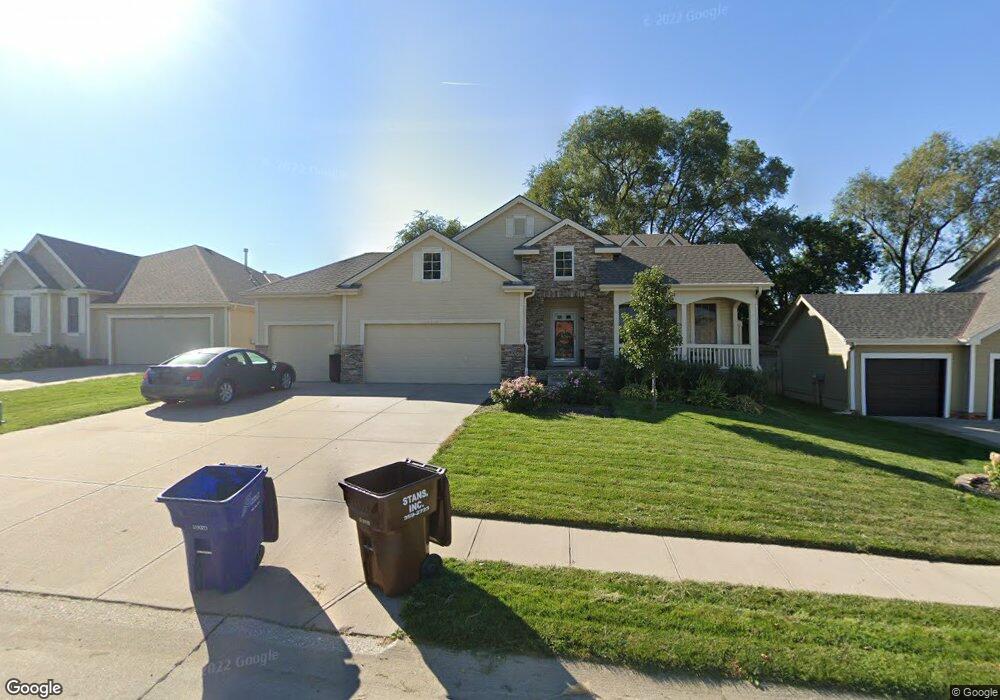
This home is located at 16805 Briar St, Omaha, NE 68136 and is currently estimated at $443,597, approximately $198 per square foot. 16805 Briar St is a home located in Sarpy County with nearby schools including Palisades Elementary School, Gretna Middle School, and Gretna High School.
Ownership History
Date
Name
Owned For
Owner Type
Purchase Details
Closed on
Aug 30, 2024
Sold by
Kuker Jon P
Bought by
Kuker Carolina
Current Estimated Value
Purchase Details
Closed on
Jul 27, 2021
Sold by
Lopez Carolina D and Kuker Carolina D
Bought by
Kuker Carolina D and Kuker Jon P
Purchase Details
Closed on
Dec 23, 2014
Sold by
Mackey Gene C and Mackey Ila J
Bought by
Kindig Curtis Z and Kindig Robin L
Purchase Details
Closed on
Mar 23, 2010
Sold by
Gish Larry J and Gish Erica
Bought by
Kuker Jon P and Kuker Carolina D
Home Financials for this Owner
Home Financials are based on the most recent Mortgage that was taken out on this home.
Original Mortgage
$182,000
Interest Rate
4.93%
Purchase Details
Closed on
Sep 13, 2007
Sold by
Stalnaker Thomas D
Bought by
Gish Larry J and Gish Erica
Home Financials for this Owner
Home Financials are based on the most recent Mortgage that was taken out on this home.
Original Mortgage
$218,500
Interest Rate
6.55%
Create a Home Valuation Report for This Property
The Home Valuation Report is an in-depth analysis detailing your home's value as well as a comparison with similar homes in the area
Home Values in the Area
Average Home Value in this Area
Purchase History
| Date | Buyer | Sale Price | Title Company |
|---|---|---|---|
| Kuker Carolina | -- | None Listed On Document | |
| Kuker Carolina D | -- | None Available | |
| Kindig Curtis Z | $6,000 | Nebraska Title Company | |
| Kuker Jon P | $232,000 | Sts | |
| Gish Larry J | $230,000 | Fnt |
Source: Public Records
Mortgage History
| Date | Status | Borrower | Loan Amount |
|---|---|---|---|
| Previous Owner | Kuker Jon P | $182,000 | |
| Previous Owner | Gish Larry J | $218,500 |
Source: Public Records
Tax History Compared to Growth
Tax History
| Year | Tax Paid | Tax Assessment Tax Assessment Total Assessment is a certain percentage of the fair market value that is determined by local assessors to be the total taxable value of land and additions on the property. | Land | Improvement |
|---|---|---|---|---|
| 2025 | $7,306 | $380,155 | $63,000 | $317,155 |
| 2024 | $8,582 | $360,234 | $62,000 | $298,234 |
| 2023 | $8,582 | $355,985 | $54,000 | $301,985 |
| 2022 | $7,830 | $315,755 | $50,000 | $265,755 |
| 2021 | $7,138 | $288,728 | $48,000 | $240,728 |
| 2020 | $6,871 | $278,048 | $43,000 | $235,048 |
| 2019 | $6,971 | $271,684 | $43,000 | $228,684 |
| 2018 | $6,679 | $256,550 | $38,000 | $218,550 |
| 2017 | $6,003 | $231,980 | $33,000 | $198,980 |
| 2016 | $6,062 | $235,216 | $33,000 | $202,216 |
| 2015 | $5,980 | $224,642 | $33,000 | $191,642 |
| 2014 | $5,830 | $221,340 | $33,000 | $188,340 |
| 2012 | -- | $217,636 | $33,000 | $184,636 |
Source: Public Records
Map
Nearby Homes
- 7810 S 166th St
- 16528 Briar St
- 7705 S 169th St
- 16904 Joanne Dr
- 16521 Redwood St
- 16641 Olive St
- 7404 S 169th St
- 7501 S 170th St
- 16334 Heather St
- 7820 S 173rd St
- 16307 Birch Ave
- 7501 S 166th St
- 16603 Edna St
- 7734 S 162nd St
- 8620 S 168th Ave
- 7853 S 162nd St
- 7216 S 170th St
- 8704 S 169th St
- 8711 S 169th St
- 17511 Greenleaf St
- 16809 Briar St
- 16903 Briar St
- 7935 S 169th St
- 7914 S 168th Ave
- 16907 Briar St
- 7931 169
- 7931 S 169 St
- 7931 S 169th St
- 7910 S 168th Ave
- 7934 S 169th St
- 16911 Briar St
- 7927 S 169th St
- 7906 S 168th Ave
- 7930 S 169th St
- 16914 Briar St
- 16915 Briar St
- 8004 S 167th St
- 7918 S 167th St
- 7926 S 169th St
- 8008 S 167th St