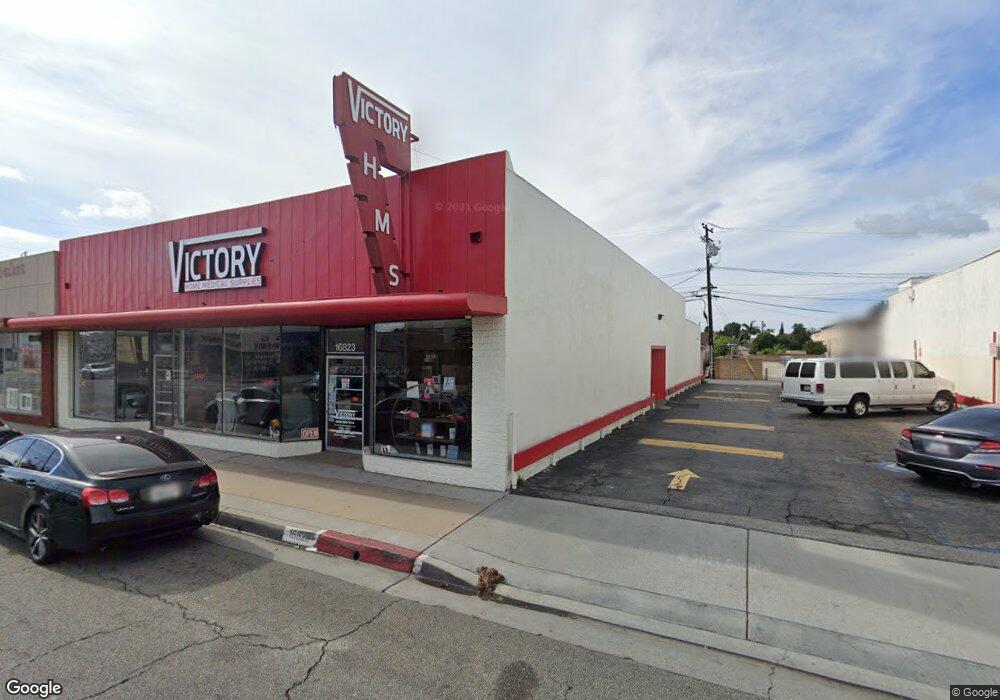
16823 Bellflower Blvd Bellflower, CA 90706
--
Bed
--
Bath
5,000
Sq Ft
6,055
Sq Ft Lot
About This Home
This home is located at 16823 Bellflower Blvd, Bellflower, CA 90706. 16823 Bellflower Blvd is a home located in Los Angeles County with nearby schools including Thomas Jefferson Elementary School, Mayfair High School, and Trinity Christian School.
Ownership History
Date
Name
Owned For
Owner Type
Purchase Details
Closed on
Feb 1, 2017
Sold by
Kim & Sons Llc
Bought by
Kim & Sons Llc
Home Financials for this Owner
Home Financials are based on the most recent Mortgage that was taken out on this home.
Original Mortgage
$700,000
Outstanding Balance
$581,507
Interest Rate
4.32%
Mortgage Type
Commercial
Purchase Details
Closed on
Jul 13, 2016
Sold by
Chang Wan Woong
Bought by
Kin & Sons Llc
Purchase Details
Closed on
Apr 22, 2011
Sold by
Chang Young Hee
Bought by
Chang Wan Woong
Home Financials for this Owner
Home Financials are based on the most recent Mortgage that was taken out on this home.
Original Mortgage
$130,000
Interest Rate
4.77%
Mortgage Type
Seller Take Back
Purchase Details
Closed on
Mar 21, 2011
Sold by
Norris Richard G
Bought by
Chang Wan Woong
Home Financials for this Owner
Home Financials are based on the most recent Mortgage that was taken out on this home.
Original Mortgage
$130,000
Interest Rate
4.77%
Mortgage Type
Seller Take Back
Create a Home Valuation Report for This Property
The Home Valuation Report is an in-depth analysis detailing your home's value as well as a comparison with similar homes in the area
Home Values in the Area
Average Home Value in this Area
Purchase History
| Date | Buyer | Sale Price | Title Company |
|---|---|---|---|
| Kim & Sons Llc | -- | Provident Title Company | |
| Kin & Sons Llc | $930,000 | First American Title Ins Co | |
| Chang Wan Woong | -- | North American Title Company | |
| Chang Wan Woong | $450,000 | North American Title Company |
Source: Public Records
Mortgage History
| Date | Status | Borrower | Loan Amount |
|---|---|---|---|
| Open | Kim & Sons Llc | $700,000 | |
| Previous Owner | Chang Wan Woong | $130,000 |
Source: Public Records
Tax History Compared to Growth
Tax History
| Year | Tax Paid | Tax Assessment Tax Assessment Total Assessment is a certain percentage of the fair market value that is determined by local assessors to be the total taxable value of land and additions on the property. | Land | Improvement |
|---|---|---|---|---|
| 2025 | $7,622 | $574,483 | $377,187 | $197,296 |
| 2024 | $7,622 | $563,220 | $369,792 | $193,428 |
| 2023 | $7,335 | $552,178 | $362,542 | $189,636 |
| 2022 | $7,204 | $541,352 | $355,434 | $185,918 |
| 2021 | $7,035 | $530,738 | $348,465 | $182,273 |
| 2020 | $6,973 | $525,297 | $344,892 | $180,405 |
| 2019 | $6,855 | $514,998 | $338,130 | $176,868 |
| 2018 | $6,588 | $504,900 | $331,500 | $173,400 |
| 2016 | $4,867 | $357,144 | $194,806 | $162,338 |
| 2015 | $4,772 | $351,780 | $191,880 | $159,900 |
| 2014 | $4,718 | $344,890 | $188,122 | $156,768 |
Source: Public Records
Map
Nearby Homes
- 9833 Walnut St
- 16712 Bellflower Blvd
- 9719 Belmont St
- 9716 Oak St
- 9929 Park St
- 9833 Palm St
- 9529 Oak St
- 10013 Flora Vista St
- 9921 Flora Vista St Unit 5
- 16414 Cornuta Ave Unit 8
- 16414 Cornuta Ave Unit 11
- 16414 Cornuta Ave Unit 9
- 9527 Los Angeles St
- 9334 Alondra Blvd
- 9548 Alondra Blvd
- 9312 Palm St Unit 209
- 9713 Cedar St
- 15751 Blaine Ave
- 9224 Walnut St
- 9231 Laurel St
- 16827 Bellflower Blvd
- 9745 Maple St
- 9741 Maple St
- 16801 Bellflower Blvd Unit 9750
- 16801 Bellflower Blvd
- 9738 Maple St
- 9736 Maple St Unit A
- 9736 Maple St Unit B
- 16916 Bellflower Blvd
- 16922 Bellflower Blvd
- 9734 Maple St Unit C
- 9734 Maple St Unit B
- 9734 Maple St Unit A
- 9751 Flower St
- 9743 Walnut St
- 9726 Maple St
- 9731 Walnut St
- 16925 Bellflower Blvd
- 9721 Maple St
- 9741 Walnut St