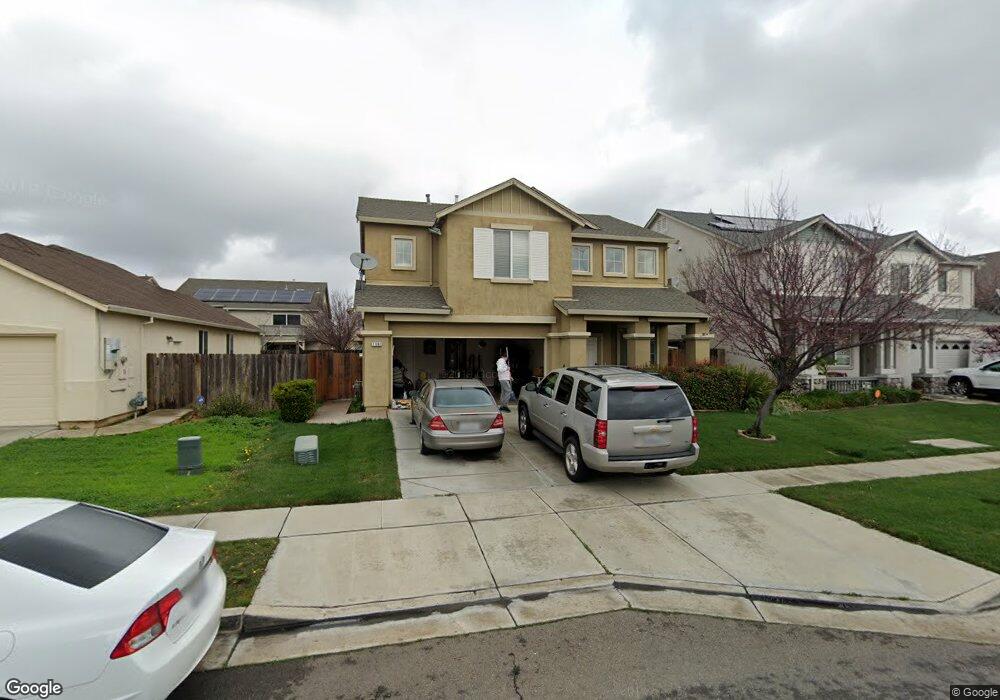
1683 Fontanella Way Stockton, CA 95205
Midtown NeighborhoodEstimated Value: $481,899 - $577,000
4
Beds
3
Baths
1,899
Sq Ft
$269/Sq Ft
Est. Value
About This Home
This home is located at 1683 Fontanella Way, Stockton, CA 95205 and is currently estimated at $511,225, approximately $269 per square foot. 1683 Fontanella Way is a home located in San Joaquin County with nearby schools including Harrison Elementary School, Grunsky Elementary School, and August Elementary School.
Ownership History
Date
Name
Owned For
Owner Type
Purchase Details
Closed on
Nov 7, 2019
Sold by
Medrano Eduardo
Bought by
Medrano Eduardo and Cobian Alma G Arreguin
Current Estimated Value
Home Financials for this Owner
Home Financials are based on the most recent Mortgage that was taken out on this home.
Original Mortgage
$288,999
Outstanding Balance
$254,497
Interest Rate
3.65%
Mortgage Type
New Conventional
Estimated Equity
$256,728
Purchase Details
Closed on
Sep 18, 2017
Sold by
King Curry Lavette and Luckey Claudine
Bought by
King Curry Lavette and Curry Alonzo
Purchase Details
Closed on
Aug 18, 2005
Sold by
Stockton Montego Lp
Bought by
Medrano Eduardo
Home Financials for this Owner
Home Financials are based on the most recent Mortgage that was taken out on this home.
Original Mortgage
$38,978
Interest Rate
5.64%
Mortgage Type
Credit Line Revolving
Create a Home Valuation Report for This Property
The Home Valuation Report is an in-depth analysis detailing your home's value as well as a comparison with similar homes in the area
Home Values in the Area
Average Home Value in this Area
Purchase History
| Date | Buyer | Sale Price | Title Company |
|---|---|---|---|
| Medrano Eduardo | -- | Placer Title Company | |
| King Curry Lavette | $169,000 | None Available | |
| Medrano Eduardo | $390,000 | Old Republic Title Co |
Source: Public Records
Mortgage History
| Date | Status | Borrower | Loan Amount |
|---|---|---|---|
| Open | Medrano Eduardo | $288,999 | |
| Previous Owner | Medrano Eduardo | $38,978 | |
| Previous Owner | Medrano Eduardo | $311,824 |
Source: Public Records
Tax History Compared to Growth
Tax History
| Year | Tax Paid | Tax Assessment Tax Assessment Total Assessment is a certain percentage of the fair market value that is determined by local assessors to be the total taxable value of land and additions on the property. | Land | Improvement |
|---|---|---|---|---|
| 2025 | $6,057 | $491,500 | $145,000 | $346,500 |
| 2024 | $5,877 | $482,700 | $140,000 | $342,700 |
| 2023 | $5,643 | $458,000 | $90,000 | $368,000 |
| 2022 | $5,605 | $458,000 | $90,000 | $368,000 |
| 2021 | $4,730 | $395,000 | $90,000 | $305,000 |
| 2020 | $3,963 | $322,000 | $90,000 | $232,000 |
| 2019 | $4,026 | $322,000 | $90,000 | $232,000 |
| 2018 | $3,664 | $293,000 | $90,000 | $203,000 |
| 2017 | $3,527 | $292,000 | $87,000 | $205,000 |
| 2016 | $3,033 | $238,000 | $71,000 | $167,000 |
| 2014 | $2,436 | $194,000 | $58,000 | $136,000 |
Source: Public Records
Map
Nearby Homes
- 3605 Gloria Ct
- 1771 Fontanella Way
- 3515 Carly Dr
- 3704 San Rafael Ave
- 2036 Mighty Oak Dr
- 3537 West Ln
- 3611 West Ln
- 4028 Trieste Cir
- 3540 San Mateo Ave
- 2224 Big Oak Ct
- 2312 E Stadium Dr
- 2337 E Alpine Ave
- 2347 E Alpine Ave
- 4503 White Forge Dr
- 2340 Sanguinetti Ln Unit 54
- 2340 Sanguinetti Ln Unit 109
- 4437 Harmony Hill Way
- 4233 Verdant St
- 746 Wright Ave
- 4450 Oakfield Dr
- 1699 Fontanella Way
- 1669 Fontanella Way
- 1640 Gloria Dr
- 1707 Fontanella Way
- 1654 Gloria Dr
- 1638 Gloria Dr
- 1653 Fontanella Way
- 1630 Gloria Dr
- 1684 Fontanella Way
- 1715 Fontanella Way
- 1670 Fontanella Way
- 1670 Gloria Dr
- 1637 Fontanella Way
- 1654 Fontanella Way
- 1710 Fontanella Way
- 1622 Gloria Dr
- 1723 Fontanella Way
- 1708 Gloria Dr
- 1718 Fontanella Way