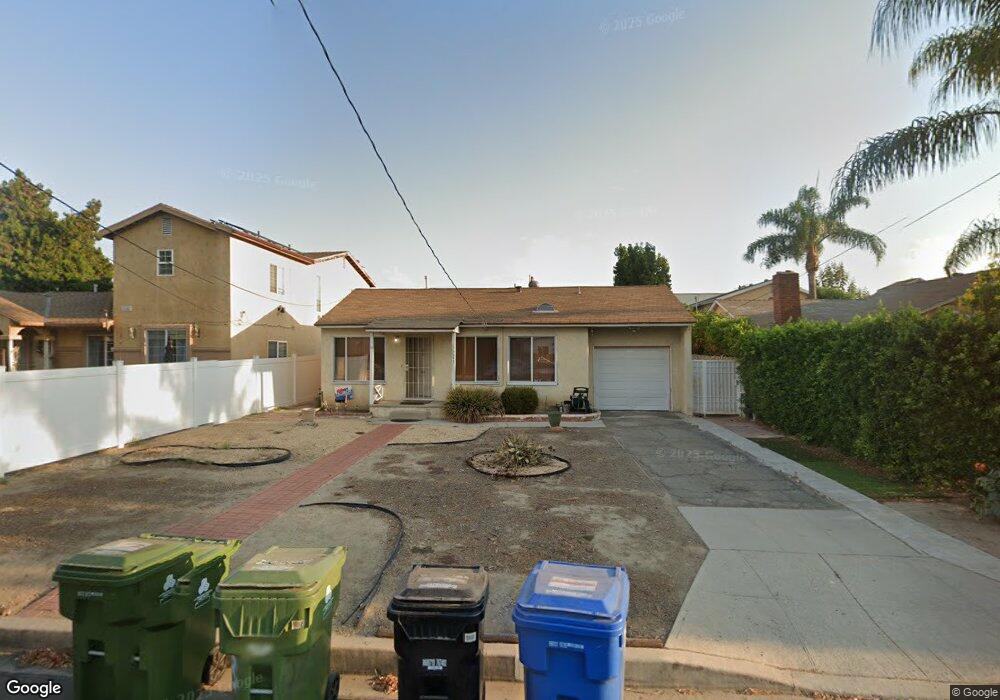
16843 Covello St van Nuys, CA 91406
Estimated Value: $670,964 - $746,000
2
Beds
1
Bath
873
Sq Ft
$823/Sq Ft
Est. Value
About This Home
This home is located at 16843 Covello St, van Nuys, CA 91406 and is currently estimated at $718,241, approximately $822 per square foot. 16843 Covello St is a home located in Los Angeles County with nearby schools including Stagg Street Elementary, William Mulholland Middle, and Birmingham Community Charter High.
Ownership History
Date
Name
Owned For
Owner Type
Purchase Details
Closed on
May 27, 2003
Sold by
Gallardo Raul
Bought by
Gallardo Raul S and Gallardo Anita
Current Estimated Value
Purchase Details
Closed on
Aug 9, 2000
Sold by
Munoz Jose J
Bought by
Gallardo Raul and Gallardo Ann
Home Financials for this Owner
Home Financials are based on the most recent Mortgage that was taken out on this home.
Original Mortgage
$103,250
Interest Rate
8.86%
Purchase Details
Closed on
Mar 11, 1997
Sold by
California Federal Bank Fsb
Bought by
Munoz Jose Juan and Munoz Alexandra Patricia
Home Financials for this Owner
Home Financials are based on the most recent Mortgage that was taken out on this home.
Original Mortgage
$108,450
Interest Rate
7.86%
Mortgage Type
FHA
Purchase Details
Closed on
Nov 5, 1996
Sold by
Halici Kirkor and Halici Mayram
Bought by
California Federal Bank Fsb and California Fsla
Create a Home Valuation Report for This Property
The Home Valuation Report is an in-depth analysis detailing your home's value as well as a comparison with similar homes in the area
Home Values in the Area
Average Home Value in this Area
Purchase History
| Date | Buyer | Sale Price | Title Company |
|---|---|---|---|
| Gallardo Raul S | -- | -- | |
| Gallardo Raul | $147,500 | Investors Title Company | |
| Munoz Jose Juan | $109,500 | First American Title Co | |
| California Federal Bank Fsb | $96,840 | -- |
Source: Public Records
Mortgage History
| Date | Status | Borrower | Loan Amount |
|---|---|---|---|
| Previous Owner | Gallardo Raul | $103,250 | |
| Previous Owner | Munoz Jose Juan | $108,450 |
Source: Public Records
Tax History Compared to Growth
Tax History
| Year | Tax Paid | Tax Assessment Tax Assessment Total Assessment is a certain percentage of the fair market value that is determined by local assessors to be the total taxable value of land and additions on the property. | Land | Improvement |
|---|---|---|---|---|
| 2025 | $2,827 | $222,237 | $169,962 | $52,275 |
| 2024 | $2,827 | $217,880 | $166,630 | $51,250 |
| 2023 | $2,775 | $213,609 | $163,363 | $50,246 |
| 2022 | $2,649 | $209,421 | $160,160 | $49,261 |
| 2021 | $2,614 | $205,316 | $157,020 | $48,296 |
| 2019 | $2,538 | $199,227 | $152,363 | $46,864 |
| 2018 | $2,471 | $195,322 | $149,376 | $45,946 |
| 2016 | $2,355 | $187,740 | $143,577 | $44,163 |
| 2015 | $2,322 | $184,921 | $141,421 | $43,500 |
| 2014 | $2,338 | $181,299 | $138,651 | $42,648 |
Source: Public Records
Map
Nearby Homes
- 7514 Paso Robles Ave
- 16823 Valerio St
- 16822 Valerio St
- 16654 Kelsloan St
- 7304 Balboa Blvd Unit C
- 7645 Genesta Ave
- 7301 Balboa Blvd Unit 8
- 7507 Oak Park Ave
- 7656 Oak Park Ave
- 7231 Balboa Blvd Unit A
- 7800 Balboa Blvd
- 17064 Cantlay St
- 7129 Forbes Ave
- 7927 Paso Robles Ave
- 7058 Petit Ave
- 7038 Mclennan Ave
- 17232 Elkwood St
- 17337 Saticoy St
- 7909 Aldea Ave
- 7927 Aldea Ave
- 16839 Covello St
- 16847 Covello St
- 16833 Covello St
- 7528 Balboa Blvd
- 16838 Covello St
- 16827 Covello St
- 16836 Covello St
- 16850 Covello St
- 7513 Mclennan Ave
- 16823 Covello St
- 7512 Balboa Blvd
- 7507 Mclennan Ave
- 16819 Covello St
- 7506 Balboa Blvd
- 16822 Covello St
- 7512 Mclennan Ave
- 7501 Mclennan Ave
- 7500 Balboa Blvd
- 7537 Forbes Ave
- 16901 Covello St