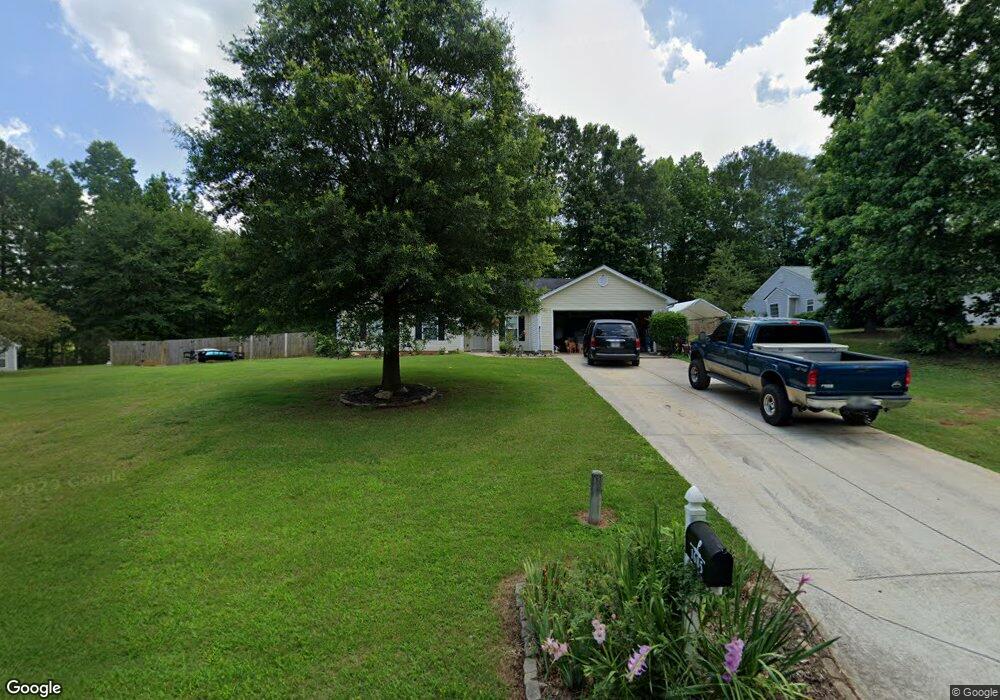
1685 Bismarck Cir Winder, GA 30680
Estimated Value: $332,000 - $358,000
3
Beds
3
Baths
1,941
Sq Ft
$179/Sq Ft
Est. Value
About This Home
This home is located at 1685 Bismarck Cir, Winder, GA 30680 and is currently estimated at $346,876, approximately $178 per square foot. 1685 Bismarck Cir is a home located in Barrow County with nearby schools including Statham Elementary School, Bear Creek Middle School, and Winder-Barrow High School.
Ownership History
Date
Name
Owned For
Owner Type
Purchase Details
Closed on
Mar 27, 2007
Sold by
Paradigm Const Co
Bought by
Porter Clifford E and Porter Shannan N
Current Estimated Value
Home Financials for this Owner
Home Financials are based on the most recent Mortgage that was taken out on this home.
Original Mortgage
$121,500
Outstanding Balance
$73,946
Interest Rate
6.27%
Mortgage Type
New Conventional
Estimated Equity
$272,930
Purchase Details
Closed on
Nov 1, 2006
Sold by
Southfork Hms Inc
Bought by
Paradigm Const Co
Home Financials for this Owner
Home Financials are based on the most recent Mortgage that was taken out on this home.
Original Mortgage
$122,320
Interest Rate
6.08%
Purchase Details
Closed on
Sep 27, 2006
Sold by
Hkb Inc
Bought by
Southfork Hms Inc
Home Financials for this Owner
Home Financials are based on the most recent Mortgage that was taken out on this home.
Original Mortgage
$122,320
Interest Rate
6.08%
Purchase Details
Closed on
Jul 25, 2002
Bought by
Hkb Inc
Create a Home Valuation Report for This Property
The Home Valuation Report is an in-depth analysis detailing your home's value as well as a comparison with similar homes in the area
Home Values in the Area
Average Home Value in this Area
Purchase History
| Date | Buyer | Sale Price | Title Company |
|---|---|---|---|
| Porter Clifford E | $141,900 | -- | |
| Paradigm Const Co | -- | -- | |
| Southfork Hms Inc | $175,000 | -- | |
| Hkb Inc | -- | -- |
Source: Public Records
Mortgage History
| Date | Status | Borrower | Loan Amount |
|---|---|---|---|
| Open | Porter Clifford E | $121,500 | |
| Previous Owner | Paradigm Const Co | $122,320 |
Source: Public Records
Tax History Compared to Growth
Tax History
| Year | Tax Paid | Tax Assessment Tax Assessment Total Assessment is a certain percentage of the fair market value that is determined by local assessors to be the total taxable value of land and additions on the property. | Land | Improvement |
|---|---|---|---|---|
| 2024 | $2,955 | $119,361 | $26,800 | $92,561 |
| 2023 | $2,322 | $110,346 | $25,200 | $85,146 |
| 2022 | $2,447 | $85,615 | $18,000 | $67,615 |
| 2021 | $2,368 | $78,478 | $18,000 | $60,478 |
| 2020 | $2,149 | $71,120 | $16,000 | $55,120 |
| 2019 | $2,184 | $71,120 | $16,000 | $55,120 |
| 2018 | $1,954 | $64,362 | $14,000 | $50,362 |
| 2017 | $1,477 | $50,722 | $14,000 | $36,722 |
| 2016 | $1,354 | $45,792 | $14,000 | $31,792 |
| 2015 | $1,370 | $46,130 | $14,000 | $32,130 |
| 2014 | $1,172 | $39,328 | $6,860 | $32,468 |
| 2013 | -- | $40,233 | $6,860 | $33,373 |
Source: Public Records
Map
Nearby Homes
- 113 Platte St
- 207 Cedar Grove Church Rd
- 670 Cedar Grove Church Rd
- 670 Cedar Grove Church Rd
- 144 Briar Rose Blvd
- 3845 S Highway 82
- 1724 Cedar Grove Church Rd
- 1453 Solomon Dr
- 1431 Solomon Dr
- 1023 Solomon Ct
- 385 Finch Landing Rd
- 212 Rainbow Ln
- 51 Brockton Way Unit 2
- 1415 Red Oak Way
- 1914 Hearthstone Ct
- 0 Berch Tree Trail Unit LOT 12
- 0 Berch Tree Trail Unit LOT 7
- 0 Berch Tree Trail Unit 7665580
- 0 Berch Tree Trail Unit 7665573
- 1642 White Oak Dr
- 1683 Bismarck Cir
- 1687 Bismarck Cir
- 1689 Bismarck Cir
- 213 Stream Side Ct
- 213 Stream Side Ct Unit Court
- 212 Stream Side Ct Unit 13
- 212 Stream Side Ct
- 1679 Bismarck Cir
- 1691 Bismarck Cir
- 210 Stream Side Ct Unit Ct
- 210 Stream Side Ct
- 211 Stream Side Ct
- 1675 Bismarck Cir
- 1415 Blanding Way
- 1415 Blanding Way (Lot50b)
- 208 Stream Side Ct Unit Ct
- 208 Stream Side Ct
- 209 Stream Side Ct Unit Ct
- 209 Stream Side Ct
- 209 Stream Unit Ct