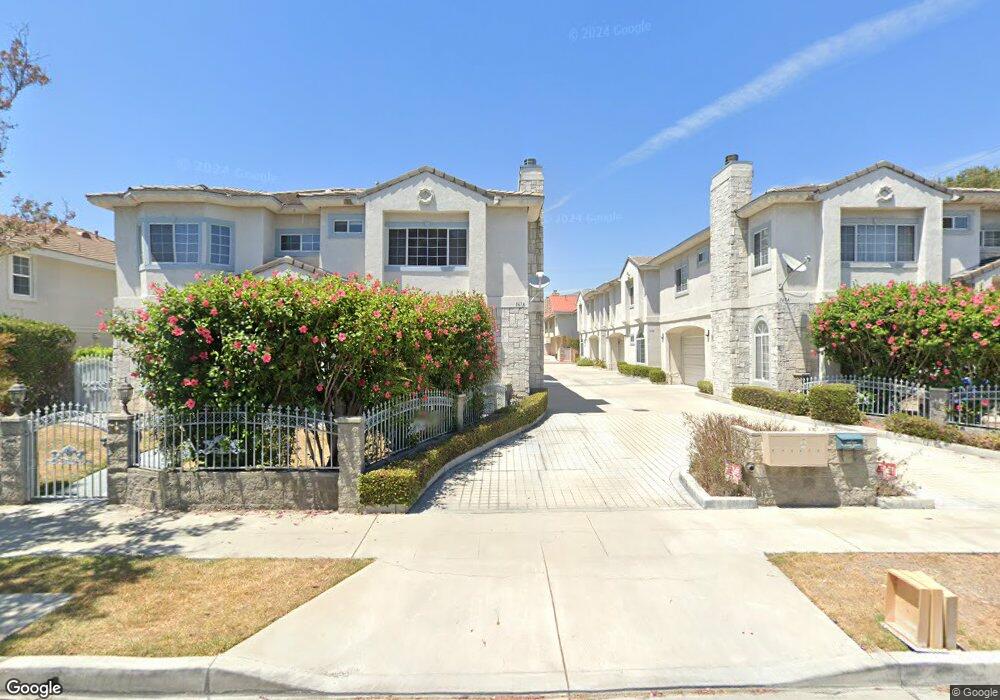
169 Eldorado St Unit C Arcadia, CA 91006
Estimated Value: $1,185,000 - $1,321,582
3
Beds
4
Baths
2,317
Sq Ft
$535/Sq Ft
Est. Value
About This Home
This home is located at 169 Eldorado St Unit C, Arcadia, CA 91006 and is currently estimated at $1,239,396, approximately $534 per square foot. 169 Eldorado St Unit C is a home located in Los Angeles County with nearby schools including Holly Avenue Elementary School, First Avenue Middle School, and Arcadia High School.
Ownership History
Date
Name
Owned For
Owner Type
Purchase Details
Closed on
Feb 16, 2013
Sold by
Gokanapudy Devi K and Gokanapudy Anjaneyulu
Bought by
Gokanapudy Devi Kanyakumari and Gokanapudy Anjaneyulu
Current Estimated Value
Purchase Details
Closed on
Dec 1, 2004
Sold by
Wu Chin Hsu and Chai Chuan
Bought by
Gokanapudy Devi K and Gokanapudy Anjaneyulu
Home Financials for this Owner
Home Financials are based on the most recent Mortgage that was taken out on this home.
Original Mortgage
$330,000
Interest Rate
5.64%
Mortgage Type
Purchase Money Mortgage
Purchase Details
Closed on
Jul 6, 1999
Sold by
Chen Hai and Chen Won Chin Chei
Bought by
Wu Chin Hsu and Chai Chuan
Home Financials for this Owner
Home Financials are based on the most recent Mortgage that was taken out on this home.
Original Mortgage
$150,000
Interest Rate
7.24%
Mortgage Type
Purchase Money Mortgage
Create a Home Valuation Report for This Property
The Home Valuation Report is an in-depth analysis detailing your home's value as well as a comparison with similar homes in the area
Home Values in the Area
Average Home Value in this Area
Purchase History
| Date | Buyer | Sale Price | Title Company |
|---|---|---|---|
| Gokanapudy Devi Kanyakumari | -- | None Available | |
| Gokanapudy Devi K | $628,000 | Fidelity National Title Comp | |
| Wu Chin Hsu | $344,000 | -- |
Source: Public Records
Mortgage History
| Date | Status | Borrower | Loan Amount |
|---|---|---|---|
| Previous Owner | Gokanapudy Devi K | $330,000 | |
| Previous Owner | Wu Chin Hsu | $150,000 | |
| Closed | Gokanapudy Devi K | $65,000 |
Source: Public Records
Tax History
| Year | Tax Paid | Tax Assessment Tax Assessment Total Assessment is a certain percentage of the fair market value that is determined by local assessors to be the total taxable value of land and additions on the property. | Land | Improvement |
|---|---|---|---|---|
| 2025 | $13,346 | $1,191,257 | $768,127 | $423,130 |
| 2024 | $13,346 | $1,167,900 | $753,066 | $414,834 |
| 2023 | $13,067 | $1,145,000 | $738,300 | $406,700 |
| 2022 | $9,470 | $824,875 | $552,461 | $272,414 |
| 2021 | $9,293 | $808,702 | $541,629 | $267,073 |
| 2019 | $9,030 | $784,717 | $525,565 | $259,152 |
| 2018 | $8,796 | $769,331 | $515,260 | $254,071 |
| 2016 | $8,567 | $739,458 | $495,252 | $244,206 |
| 2015 | $8,419 | $728,351 | $487,813 | $240,538 |
| 2014 | $8,303 | $714,085 | $478,258 | $235,827 |
Source: Public Records
Map
Nearby Homes
- 154 Diamond St Unit B
- 135 Diamond St
- 590 S 3rd Ave
- 200 S 2nd Ave Unit B
- 200 S 2nd Ave Unit D
- 200 S 2nd Ave Unit C
- 165 Bonita St Unit B
- 49 Fano St Unit C
- 339 California St
- 523 S 5th Ave Unit B
- 415 California St Unit D
- 32 Diamond St Unit D
- 527 S 5th Ave Unit B
- 417 California St Unit F
- 45 Genoa St Unit A
- 158 Alice St Unit A
- 601 S 5th Ave Unit B
- 25 Fano St
- 215 S 5th Ave Unit A
- 57 Alice St Unit A
- 167 Eldorado St
- 167 El Dorado St Unit B
- 167 El Dorado St Unit A
- 169 Eldorado St Unit B
- 167 Eldorado St Unit A
- 167 Eldorado St Unit B
- 167 Eldorado St Unit C
- 169 Eldorado St Unit A
- 159 Eldorado St Unit B
- 159 Eldorado St Unit A
- 407 S 2nd Ave
- 405 S 2nd Ave
- 409 S 2nd Ave Unit 4
- 411 S 2nd Ave Unit 1
- 153 Eldorado St
- 153 Eldorado St Unit C
- 153 Eldorado St Unit B
- 153 Eldorado St Unit A
- 168 Eldorado St
- 416 S 2nd Ave
Your Personal Tour Guide
Ask me questions while you tour the home.