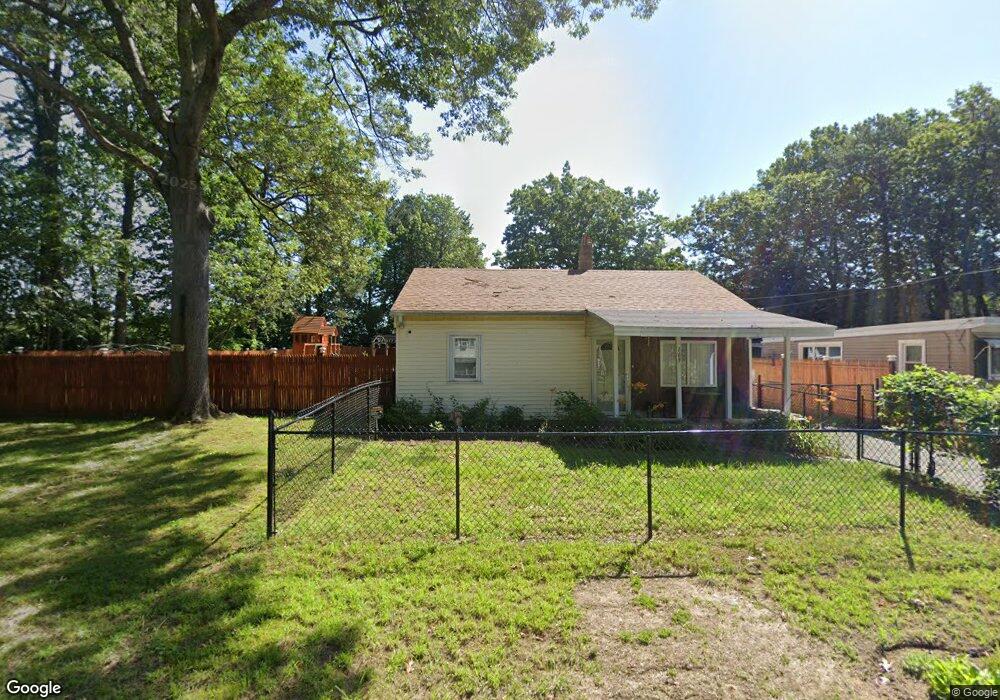
169 Fieldston St Springfield, MA 01119
Boston Road NeighborhoodEstimated Value: $181,000 - $319,000
3
Beds
1
Bath
1,320
Sq Ft
$197/Sq Ft
Est. Value
About This Home
This home is located at 169 Fieldston St, Springfield, MA 01119 and is currently estimated at $260,410, approximately $197 per square foot. 169 Fieldston St is a home located in Hampden County with nearby schools including Daniel B Brunton, John F. Kennedy Academy, and Springfield Central High School.
Ownership History
Date
Name
Owned For
Owner Type
Purchase Details
Closed on
Sep 28, 1999
Sold by
Fnma
Bought by
Rivera Carolyn
Current Estimated Value
Purchase Details
Closed on
May 11, 1999
Sold by
Burbee Richard A and Burbee Patricia A
Bought by
Federal National Mortgage Association
Purchase Details
Closed on
Aug 25, 1997
Sold by
Falvey Marlene R and Falvey David E
Bought by
Burbee Richard A and Burbee Patricia A
Create a Home Valuation Report for This Property
The Home Valuation Report is an in-depth analysis detailing your home's value as well as a comparison with similar homes in the area
Home Values in the Area
Average Home Value in this Area
Purchase History
| Date | Buyer | Sale Price | Title Company |
|---|---|---|---|
| Rivera Carolyn | $55,000 | -- | |
| Federal National Mortgage Association | $67,000 | -- | |
| Burbee Richard A | $1,500 | -- |
Source: Public Records
Mortgage History
| Date | Status | Borrower | Loan Amount |
|---|---|---|---|
| Open | Burbee Richard A | $8,391 | |
| Closed | Burbee Richard A | $9,524 |
Source: Public Records
Tax History
| Year | Tax Paid | Tax Assessment Tax Assessment Total Assessment is a certain percentage of the fair market value that is determined by local assessors to be the total taxable value of land and additions on the property. | Land | Improvement |
|---|---|---|---|---|
| 2025 | $3,426 | $218,500 | $45,300 | $173,200 |
| 2024 | $3,193 | $198,800 | $42,400 | $156,400 |
| 2023 | $3,091 | $181,300 | $40,300 | $141,000 |
| 2022 | $2,751 | $146,200 | $40,300 | $105,900 |
| 2021 | $2,519 | $133,300 | $36,700 | $96,600 |
| 2020 | $2,525 | $129,300 | $36,700 | $92,600 |
| 2019 | $2,421 | $123,000 | $36,700 | $86,300 |
| 2018 | $2,383 | $121,100 | $36,700 | $84,400 |
| 2017 | $2,389 | $121,500 | $36,700 | $84,800 |
| 2016 | $2,275 | $115,700 | $36,700 | $79,000 |
| 2015 | $2,303 | $117,100 | $36,700 | $80,400 |
Source: Public Records
Map
Nearby Homes
- 165 Fieldston St
- 176 Fieldston St
- 157 Fieldston St
- 78 Bexhill St
- 74 Bexhill St
- 68 Bexhill St
- 64 Bexhill St
- 75 Bexhill St
- 75-77 Bexhill St
- 52 Bexhill St
- 136 Fieldston St
- 141 Tavistock St
- 135 Tavistock St
- 130 Fieldston St
- 48 Bexhill St
- 131 Tavistock St
- 144 Tavistock St
- 126 Fieldston St
- 40 Bexhill St
- 125 Tavistock St
Your Personal Tour Guide
Ask me questions while you tour the home.