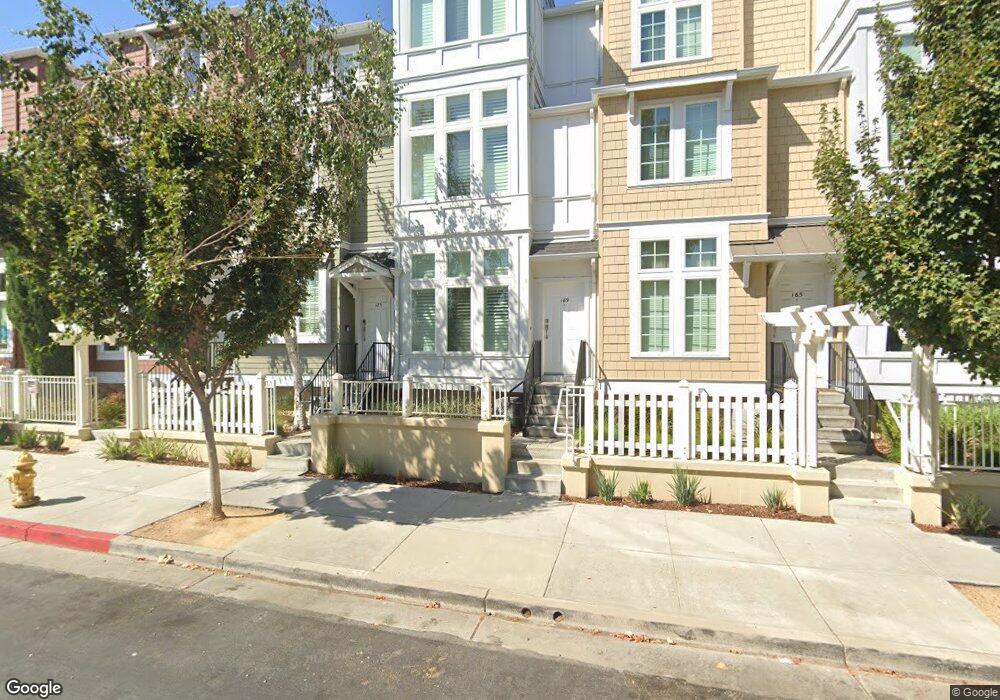
169 Laurel Grove Ln San Jose, CA 95126
Saint Leo's NeighborhoodEstimated Value: $991,000 - $1,073,537
4
Beds
3
Baths
1,650
Sq Ft
$621/Sq Ft
Est. Value
About This Home
This home is located at 169 Laurel Grove Ln, San Jose, CA 95126 and is currently estimated at $1,023,884, approximately $620 per square foot. 169 Laurel Grove Ln is a home located in Santa Clara County with nearby schools including Merritt Trace Elementary, Herbert Hoover Middle School, and Abraham Lincoln High.
Ownership History
Date
Name
Owned For
Owner Type
Purchase Details
Closed on
Oct 12, 2020
Sold by
Ramirez Rosetta
Bought by
Rosetta Ramirez Living Trust and Ramirez
Current Estimated Value
Purchase Details
Closed on
Sep 19, 2020
Sold by
Ramirez Rosetta
Bought by
Ramirez Rosetta and Rosetta Ramirez Living Trust
Purchase Details
Closed on
Oct 13, 2016
Sold by
Mendoza Nick
Bought by
Ramirez Rosetta
Home Financials for this Owner
Home Financials are based on the most recent Mortgage that was taken out on this home.
Original Mortgage
$517,400
Interest Rate
3.44%
Mortgage Type
New Conventional
Purchase Details
Closed on
Aug 30, 2004
Sold by
Cahill South Llc
Bought by
Ramirez Rosetta
Home Financials for this Owner
Home Financials are based on the most recent Mortgage that was taken out on this home.
Original Mortgage
$333,700
Interest Rate
5.25%
Mortgage Type
Purchase Money Mortgage
Create a Home Valuation Report for This Property
The Home Valuation Report is an in-depth analysis detailing your home's value as well as a comparison with similar homes in the area
Home Values in the Area
Average Home Value in this Area
Purchase History
| Date | Buyer | Sale Price | Title Company |
|---|---|---|---|
| Rosetta Ramirez Living Trust | -- | Ramirez Rosetta | |
| Ramirez Rosetta | -- | None Available | |
| Ramirez Rosetta | -- | Fidelity National Title Co | |
| Ramirez Rosetta | -- | First American Title Company |
Source: Public Records
Mortgage History
| Date | Status | Borrower | Loan Amount |
|---|---|---|---|
| Previous Owner | Ramirez Rosetta | $517,400 | |
| Previous Owner | Ramirez Rosetta | $333,700 | |
| Closed | Ramirez Rosetta | $185,420 |
Source: Public Records
Tax History Compared to Growth
Tax History
| Year | Tax Paid | Tax Assessment Tax Assessment Total Assessment is a certain percentage of the fair market value that is determined by local assessors to be the total taxable value of land and additions on the property. | Land | Improvement |
|---|---|---|---|---|
| 2025 | $10,006 | $723,562 | $348,469 | $375,093 |
| 2024 | $10,006 | $709,376 | $341,637 | $367,739 |
| 2023 | $9,801 | $695,468 | $334,939 | $360,529 |
| 2022 | $9,697 | $681,832 | $328,372 | $353,460 |
| 2021 | $9,543 | $668,464 | $321,934 | $346,530 |
| 2020 | $9,242 | $661,610 | $318,633 | $342,977 |
| 2019 | $9,011 | $648,638 | $312,386 | $336,252 |
| 2018 | $8,904 | $635,920 | $306,261 | $329,659 |
| 2017 | $8,822 | $623,452 | $300,256 | $323,196 |
| 2016 | $8,645 | $611,228 | $294,369 | $316,859 |
| 2015 | $8,594 | $602,000 | $289,900 | $312,100 |
| 2014 | $7,049 | $536,000 | $258,100 | $277,900 |
Source: Public Records
Map
Nearby Homes
- 235 Laurel Grove Ln
- 236 Grayson Terrace
- 265 Kentdale Place
- 869 Georgetown Place Unit 605
- 88 Bush St Unit 2160
- 88 Bush St Unit 3187
- 88 Bush St Unit 2173
- 88 Bush St Unit 2103
- 953 Park Ave
- 311 Bautista Place
- 1024 Parkinson Ct
- 411 Park Ave Unit 333
- 809 Auzerais Ave Unit 429
- 809 Auzerais Ave Unit 341
- 209 Race St
- 502 Hannah St
- 496 Autumn Ct
- 250 Meridian Ave
- 417 Stockton Ave
- 141 N Almaden Blvd
- 173 Laurel Grove Ln
- 165 Laurel Grove Ln
- 177 Laurel Grove Ln
- 161 Laurel Grove Ln
- 157 Laurel Grove Ln
- 181 Laurel Grove Ln
- 171 Cahill Park Dr
- 153 Laurel Grove Ln Unit 34
- 167 Cahill Park Dr
- 175 Cahill Park Dr
- 179 Cahill Park Dr
- 163 Cahill Park Dr Unit 26
- 187 Laurel Grove Ln
- 149 Laurel Grove Ln
- 159 Cahill Park Dr
- 183 Cahill Park Dr
- 193 Laurel Grove Ln
- 155 Cahill Park Dr
- 145 Laurel Grove Ln
- 189 Cahill Park Dr