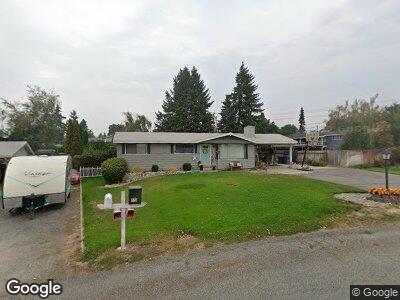
169 S Kent Place East Wenatchee, WA 98802
Estimated Value: $393,526 - $440,000
3
Beds
2
Baths
1,075
Sq Ft
$388/Sq Ft
Est. Value
About This Home
This home is located at 169 S Kent Place, East Wenatchee, WA 98802 and is currently estimated at $416,632, approximately $387 per square foot. 169 S Kent Place is a home located in Douglas County with nearby schools including Grant Elementary School, Clovis Point Intermediate School, and Eastmont Junior High School.
Ownership History
Date
Name
Owned For
Owner Type
Purchase Details
Closed on
Sep 8, 2021
Sold by
Brisbine Vicki L and Brisbine Patricia Steed
Bought by
Babst Mark R and Babst Ashley E
Current Estimated Value
Home Financials for this Owner
Home Financials are based on the most recent Mortgage that was taken out on this home.
Original Mortgage
$249,000
Outstanding Balance
$229,514
Interest Rate
2.8%
Mortgage Type
New Conventional
Estimated Equity
$203,547
Purchase Details
Closed on
Jan 12, 2016
Sold by
The Patricia H Steed Revocable Living Tr and Steed Patricia H
Bought by
Babst Mark R and Babst Ashley E
Home Financials for this Owner
Home Financials are based on the most recent Mortgage that was taken out on this home.
Original Mortgage
$150,000
Interest Rate
3%
Mortgage Type
Seller Take Back
Purchase Details
Closed on
Jul 15, 2013
Sold by
Steed Patricia and Steed Jay
Bought by
Steed Patricia
Create a Home Valuation Report for This Property
The Home Valuation Report is an in-depth analysis detailing your home's value as well as a comparison with similar homes in the area
Home Values in the Area
Average Home Value in this Area
Purchase History
| Date | Buyer | Sale Price | Title Company |
|---|---|---|---|
| Babst Mark R | -- | Pioneer Title Company | |
| Babst Mark R | $150,000 | None Available | |
| Steed Patricia | -- | None Available |
Source: Public Records
Mortgage History
| Date | Status | Borrower | Loan Amount |
|---|---|---|---|
| Open | Babst Mark R | $80,000 | |
| Open | Babst Mark R | $249,000 | |
| Previous Owner | Babst Mark R | $150,000 |
Source: Public Records
Tax History Compared to Growth
Tax History
| Year | Tax Paid | Tax Assessment Tax Assessment Total Assessment is a certain percentage of the fair market value that is determined by local assessors to be the total taxable value of land and additions on the property. | Land | Improvement |
|---|---|---|---|---|
| 2025 | $400 | $315,400 | $100,000 | $215,400 |
| 2024 | $3,183 | $328,700 | $100,000 | $228,700 |
| 2023 | $3,412 | $308,500 | $100,000 | $208,500 |
| 2022 | $3,367 | $291,300 | $80,000 | $211,300 |
| 2021 | $3,447 | $291,300 | $80,000 | $211,300 |
| 2020 | $3,192 | $276,500 | $72,000 | $204,500 |
| 2018 | $2,731 | $215,200 | $60,000 | $155,200 |
| 2017 | $2,151 | $215,200 | $60,000 | $155,200 |
| 2016 | $1,865 | $181,000 | $60,000 | $121,000 |
| 2015 | $279 | $167,200 | $60,000 | $107,200 |
| 2014 | -- | $155,200 | $60,000 | $95,200 |
| 2013 | -- | $152,400 | $60,000 | $92,400 |
Source: Public Records
Map
Nearby Homes
- 1557 1st St SE
- 1570 Tedford St SE
- 1434 Copper Loop
- 1752 S Kent Plaza
- 1741 4th St SE
- 1925 Bluegrass Ave SE
- 1375 Boulder Loop
- 1330 Boulder Loop
- 35 Mandolin Ave
- 1981 Grant Rd
- 303 S Mary Ave
- 303 S Jackson Place
- 456 S Kansas Loop
- 59 N Iowa Ave
- 105 S Houston Ave
- 207 S Houston Ave
- 501 S Lynn Ave
- 1581 S Kelvin Ct
- 1502 S Kelvin Ct
- 1920 Glen St NE
- 169 S Kent Place
- 167 S Kent Place
- 104 S Kentucky Ave
- 102 S Kentucky Ave
- 1624 1st St SE
- 171 S Kent Place
- 1620 1st St SE
- 170 S Kent Place
- 1636 1st St SE
- 1610 1st St SE
- 173 S Kent Place
- 105 S Keller Ave
- 171 S Keller Ave
- 172 S Kent Place
- 101 S Keller Ave
- 1700 1st St SE
- 1701 1st St SE
- 1635 1st St SE
- 173 S Keller Ave
- 175 S Kent Place