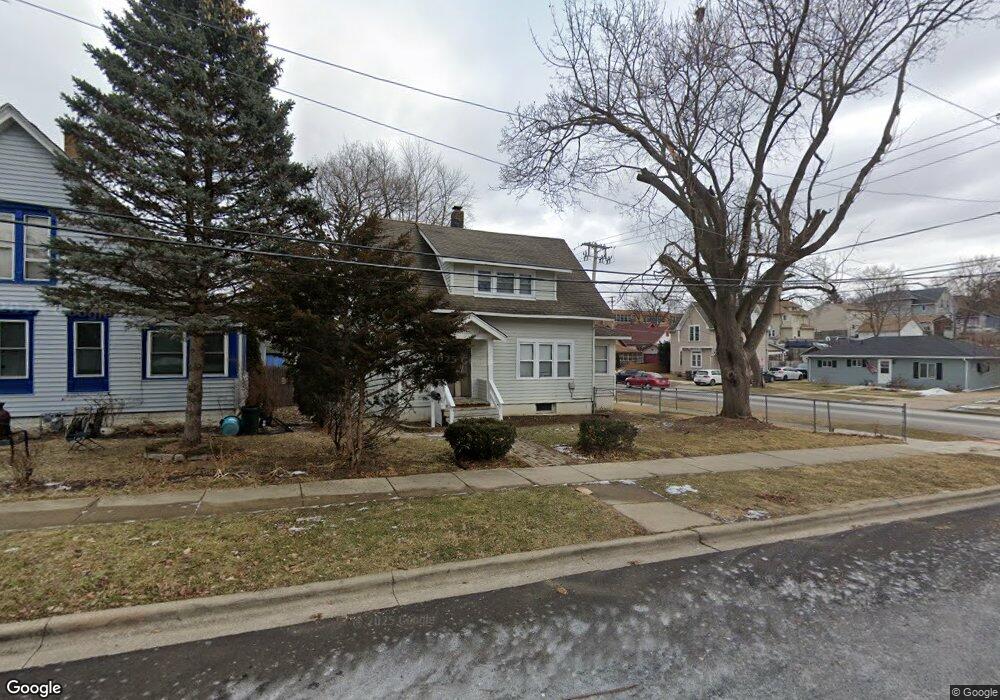
169 S Porter St Elgin, IL 60120
Gifford Park NeighborhoodEstimated Value: $227,000 - $294,868
2
Beds
1
Bath
900
Sq Ft
$301/Sq Ft
Est. Value
About This Home
This home is located at 169 S Porter St, Elgin, IL 60120 and is currently estimated at $270,467, approximately $300 per square foot. 169 S Porter St is a home located in Kane County with nearby schools including Channing Memorial Elementary School, Ellis Middle School, and Elgin High School.
Ownership History
Date
Name
Owned For
Owner Type
Purchase Details
Closed on
Mar 13, 2014
Sold by
Ramseyer Timothy P
Bought by
Austin Holdings Llc Iv
Current Estimated Value
Purchase Details
Closed on
Aug 28, 2013
Sold by
Reyna Samuel and De Reyna Remedios S
Bought by
Ramseyer Timothy P
Purchase Details
Closed on
May 17, 2007
Sold by
Morequity Inc
Bought by
Reyna Samuel
Home Financials for this Owner
Home Financials are based on the most recent Mortgage that was taken out on this home.
Original Mortgage
$111,150
Interest Rate
6.21%
Mortgage Type
Purchase Money Mortgage
Purchase Details
Closed on
Dec 29, 2006
Sold by
Gomez Jose L and Gomez Rita E
Bought by
Morequity Inc
Purchase Details
Closed on
Jun 30, 1999
Sold by
Springer Richard L and Springer Juanita J
Bought by
Gomez Jose L and Gomez Rita E
Home Financials for this Owner
Home Financials are based on the most recent Mortgage that was taken out on this home.
Original Mortgage
$114,952
Interest Rate
7.29%
Mortgage Type
FHA
Create a Home Valuation Report for This Property
The Home Valuation Report is an in-depth analysis detailing your home's value as well as a comparison with similar homes in the area
Home Values in the Area
Average Home Value in this Area
Purchase History
| Date | Buyer | Sale Price | Title Company |
|---|---|---|---|
| Austin Holdings Llc Iv | -- | None Available | |
| Ramseyer Timothy P | $63,000 | Attorneys Title Guaranty Fun | |
| Reyna Samuel | $123,500 | Multiple | |
| Morequity Inc | $165,000 | None Available | |
| Gomez Jose L | $116,000 | -- |
Source: Public Records
Mortgage History
| Date | Status | Borrower | Loan Amount |
|---|---|---|---|
| Previous Owner | Reyna Samuel | $111,150 | |
| Previous Owner | Gomez Jose L | $114,952 |
Source: Public Records
Tax History
| Year | Tax Paid | Tax Assessment Tax Assessment Total Assessment is a certain percentage of the fair market value that is determined by local assessors to be the total taxable value of land and additions on the property. | Land | Improvement |
|---|---|---|---|---|
| 2024 | $4,856 | $60,678 | $14,621 | $46,057 |
| 2023 | $4,673 | $54,818 | $13,209 | $41,609 |
| 2022 | $4,334 | $49,984 | $12,044 | $37,940 |
| 2021 | $4,169 | $46,731 | $11,260 | $35,471 |
| 2020 | $4,069 | $44,612 | $10,749 | $33,863 |
| 2019 | $3,969 | $42,496 | $10,239 | $32,257 |
| 2018 | $2,283 | $23,089 | $9,646 | $13,443 |
| 2017 | $2,245 | $21,827 | $9,119 | $12,708 |
| 2016 | $2,160 | $20,250 | $8,460 | $11,790 |
| 2015 | -- | $18,561 | $7,754 | $10,807 |
| 2014 | -- | $18,332 | $7,658 | $10,674 |
| 2013 | -- | $38,460 | $7,860 | $30,600 |
Source: Public Records
Map
Nearby Homes
- 483 Barrett St
- 450 Villa St
- 286 Villa St
- 115 N Porter St
- 277 Gifford Place
- 262 Bartlett Place
- 457 Arlington Ave
- 131 N Gifford St
- 162 Festival Ct
- 453 Addison St
- 371 North St
- 58 S Geneva St
- 631 Bent St
- 211 Prairie St
- 689 Bent St
- 518 Raymond St
- 833 Forest Ave
- 268 N Gifford St
- 363 Franklin Blvd
- 7 National St Unit 7
- 165 S Porter St
- 159 S Porter St
- 164 S Liberty St
- 162 S Liberty St
- 559 Laurel St
- 156 S Liberty St
- 555 Laurel St
- 200 S Liberty St
- 153 S Porter St
- 170 S Porter St
- 170 S Porter St Unit 2
- 170 S Porter St Unit 1
- 551 Laurel St
- 204 S Liberty St
- 150 S Liberty St
- 160 S Porter St
- 535 Laurel St
- 206 S Liberty St
- 149 S Porter St
- 154 S Porter St
Your Personal Tour Guide
Ask me questions while you tour the home.